Weekly Market Outlook – Not Really the Kind of Win You Want, But It’s Still a Win

The week didn’t start out on a particularly high note, with most traders waiting to see what the Federal Reserve had to say about interest rates on Wednesday. They appear to have liked what they heard. The bullishness that finally unfurled was enough to push stocks above important technical resistance levels. It just got much easier to continue moving higher… although there is one potential stumbling block left.
We’ll look at everything in a moment. First, let’s run through last week’s top economic announcements and then preview what’s coming this week.
Economic Data Analysis
The party started in earnest on Tuesday, with a look at last month’s retail spending. It improved, albeit it only slightly (and worsened a bit when factoring automobiles into the equation). It’s difficult to deny the average consumer continues to feel cash-crimped here.
Retail Sales Charts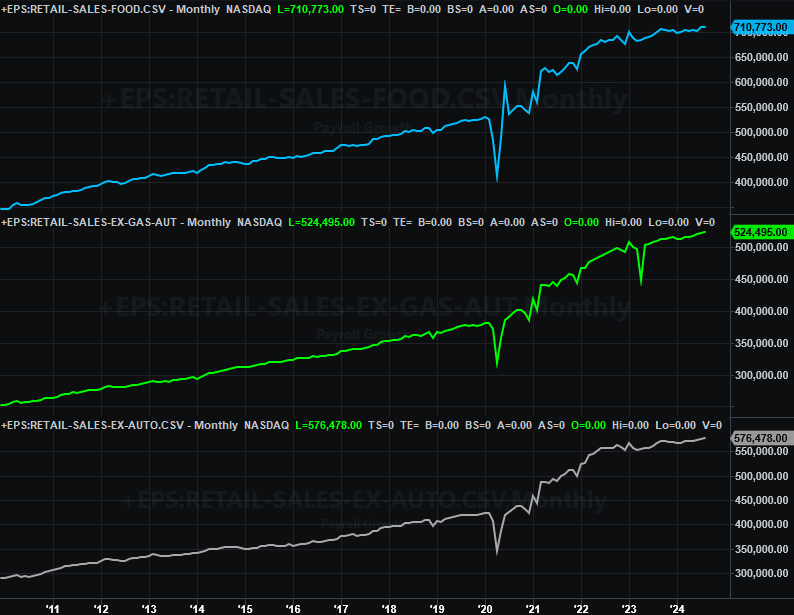
Source: Census Bureau, TradeStation
Also on Tuesday we heard August’s capacity utilization and industrial production figures. This is important data in that these numbers closely coincide with corporate earnings, and ultimately, the market’s long-term trend. We saw a slight improvement for both numbers this time around, although it’s still too soon to say these numbers are truly on the mend from last year’s lulls.
Industrial Production, Capacity Utilization Charts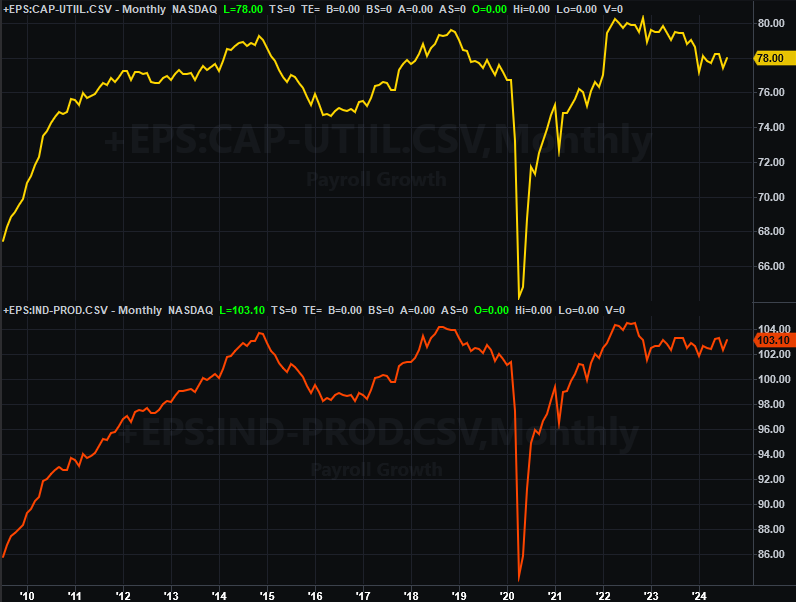
Source: Federal Reserve, TradeStation
On Wednesday we got August’s housing starts and building permits numbers. They were up a little (as anticipated), but only a little. They’re still generally at low levels, suppressed by a combination of high prices and high interest rates.
Housing Starts and Building Permits Charts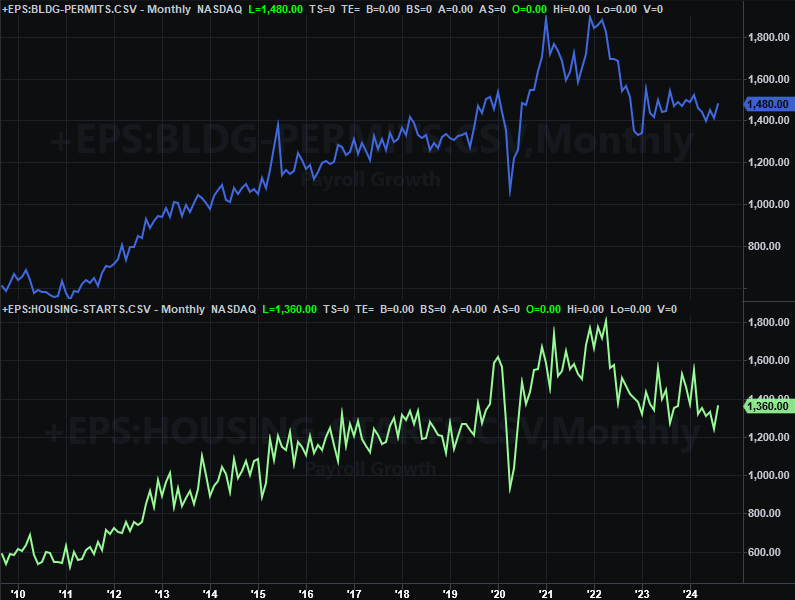
Source: Census Bureau, TradeStation
Those rates will be coming down at least a little though, and soon. (They already have, in fact.) On Wednesday the Federal Reserve also cut the Fed Funds Rate by basis points, hoping this will stimulate economic activity without rekindling inflation.
Finally, on Thursday we heard August’s pace of existing home sales. As expected, they fell from July’s tepid levels, but by more than expected. There’s no denying the downtrend here. It remains to be seen if or by how much lower interest rates will help.
New, Existing Home Sales Charts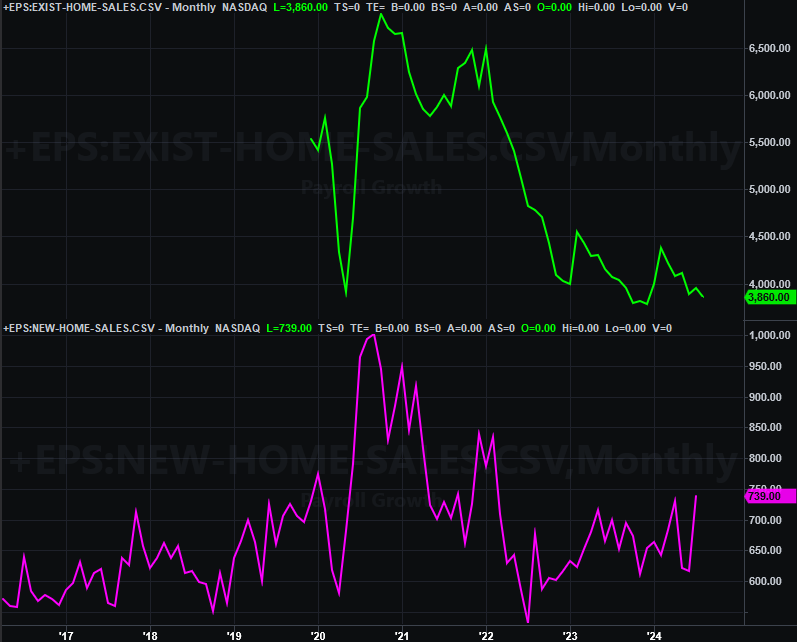
Source: National Assn. of Realtors, Census Bureau, TradeStation
New home sales will be reported this week, rounding out the activity picture. Economists are looking for a slight drop from July’s annualized surge to a pace of 739,000 units. The bigger trend here, however, still looks like it’s trying to start edging higher again, as it’s still easier to purchase a new home than find an existing one that’s for sale.
Everything else is on the grid.
Economic Calendar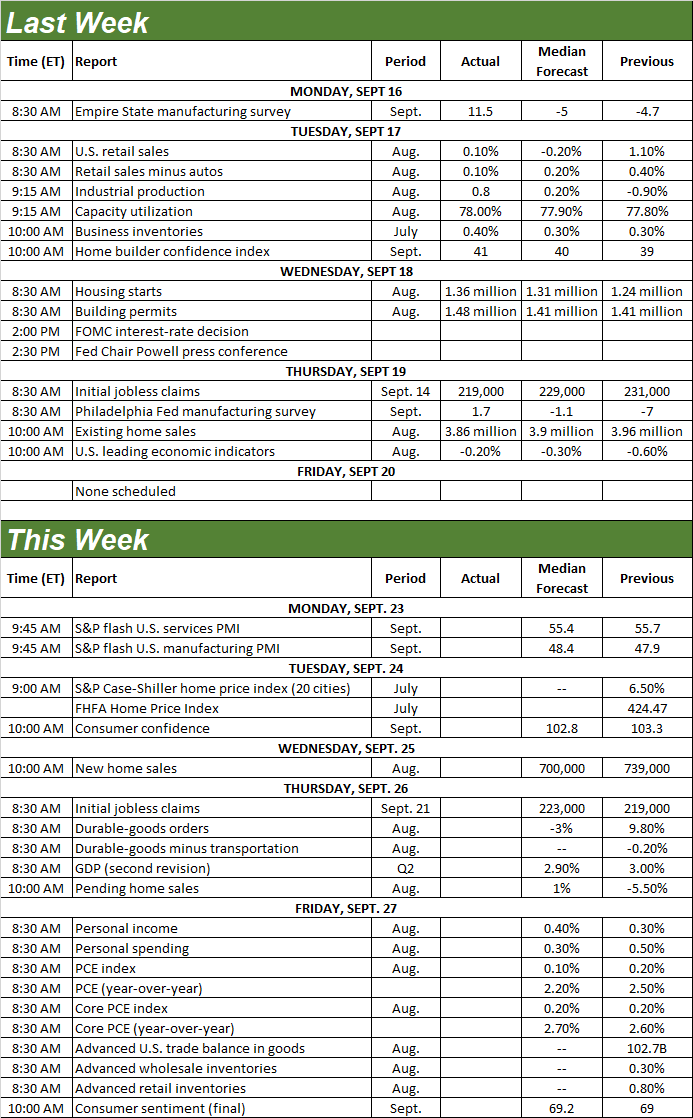
Source: Briefing.com
Also this week we’ll get updates on home prices. Although numbers are only for July -- and much has happened in the meantime -- the Case-Shiller Index and the FHFA Home Price Index will still both give us a glimpse of at least on aspect of the real estate market’s health. As the chart shows, prices remain healthy even if net purchases are weak. That hasn’t likely changed in the meantime.
Home Price Index Charts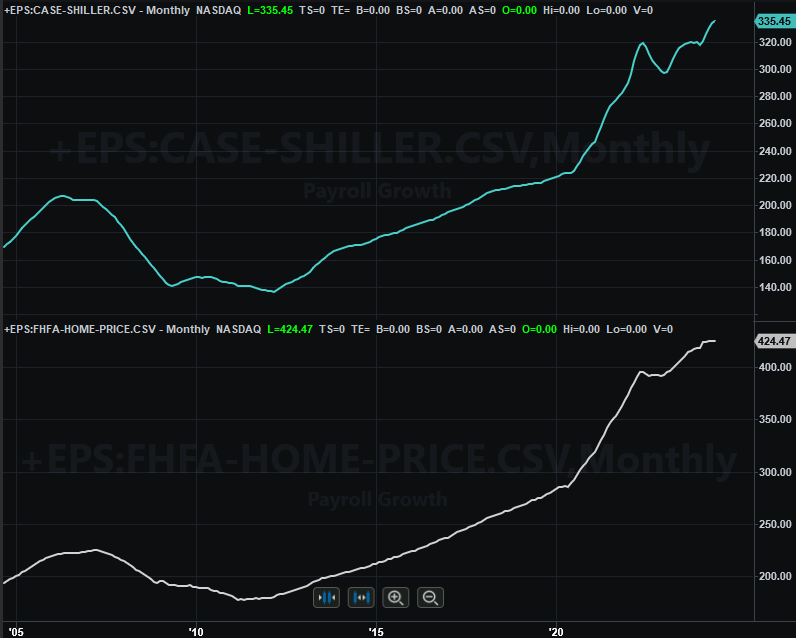
Source: Standard & Poor’s, FHFA, TradeStation
It’s also an important week for consumer sentiment. The Conference Board’s consumer confidence score for September will be released on Tuesday, while the University of Michigan’s final consumer sentiment number will be posted on Friday. Forecasts suggests both will more or less be in line with last month’s numbers, which are still stuck as subpar levels.
Consumer Sentiment Charts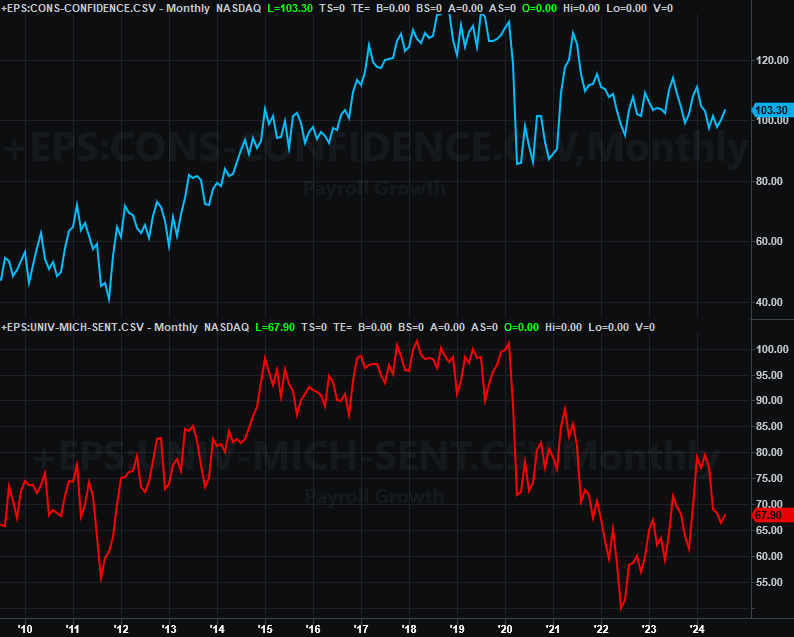
Source: Conference Board, University of Michigan, TradeStation
Although we’re not charting it here, be aware that Friday’s personal income and personal expenditure reports are vitally important to the Fed when it comes to making decisions regarding interest rates. Obviously August’s data wasn’t available last week to fuel the decision, but the numbers will likely help steer the FOMC the next time the matter comes up again in early November.
Stock Market Index Analysis
Weird week. The S&P 500 managed to log nearly a 1.3% gain for the five-day stretch following the Federal Reserve 50-basis-point rate cut, but it’s not clear that Wednesday’s call actually forced that gain. It happened overnight, after Wednesday’s close, and before Thursday’s open. It’s possible Friday’s triple-witching option expiration had something to do with the move, or perhaps similar rate decisions in other parts of the world were a factor. Whatever the case, it’s not quite the way you’d like to see it happen. Generally smooth, measured moves persist. This one’s anything but smooth and measured.
Still, just as much as the charts suggest what and how traders are thinking, charts also lead traders to conclusions. Last week’s move into record-high territory (at least for the S&P 500; the NASDAQ broke through a different ceiling) is compelling, even if it’s the wrong time of year for this to be happening.
It’s clear on the daily chart of the S&P 500 below. The index danced with July’s peak near 5,668 (green, dashed) on Tuesday and Wednesday without ever actually clearing it. Once past that ceiling on Thursday though, the bulls had no intention of giving up that ground.
S&P 500 Daily Chart, with VIX and Volume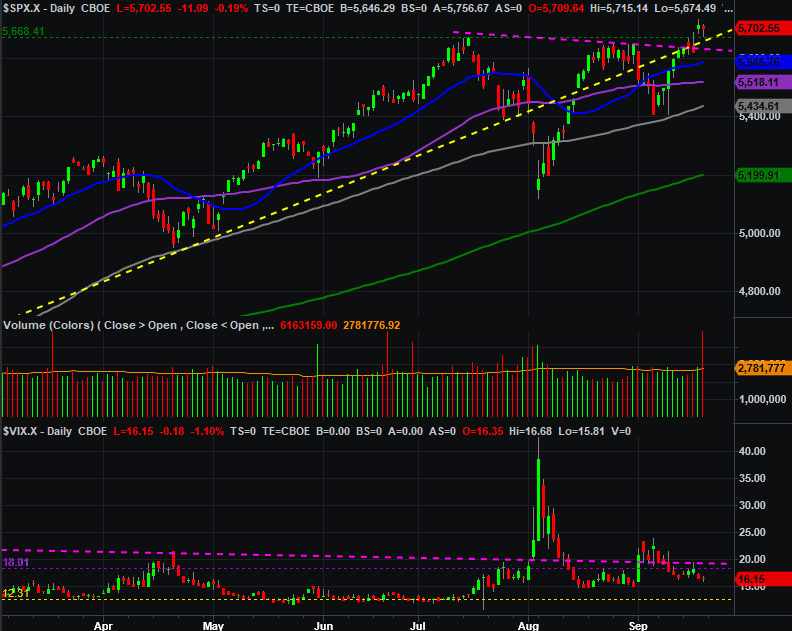
Source: TradeNavigator
Here’s the weekly chart of the S&P 500 for a little more perspective. It doesn’t show us much that’s new, but notice that the ceiling in question -- around 5,670 -- is also the suggested upside target from the cup-and-handle pattern that was completed late last year.
S&P 500 Weekly Chart, with VIX and MACD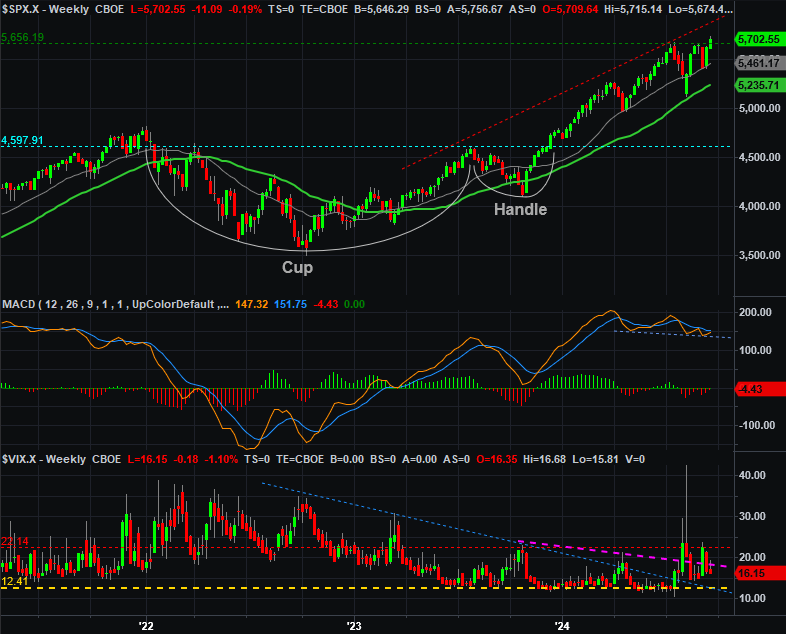
Source: TradeNavigator
Blasting through these cup-and-handle upside targets is less likely to happen without a major corrective move first, although there are exceptions. Either way, this bullishness is even more significant in light of the fact that the technical ceiling at 5,668 is a line in the sand for several reasons.
The NASDAQ Composite hasn’t followed suit. It would need to reach the 19,100 to complete the cup-and-handle breakout pattern. Still, it punched through a minor, falling technical resistance line (pink, dashed), and there’s plenty of room between 17,950 and 19,100 to continue making forward progress.
NASDAQ Composite Weekly Chart, with VXN and MACD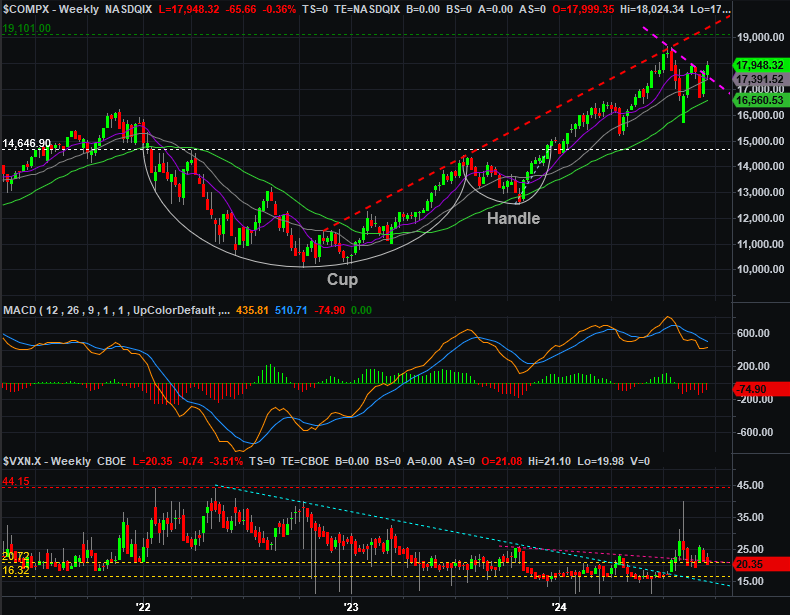
Source: TradeNavigator
The daily chart of the NASDAQ fleshes out some detail. It did manage to hurdle August’s peak near 17,973, but just barely. And again, this isn’t the kind of bullishness that suggests more of the same is immediately in store. Traders jumped to a conclusion on Thursday, but they just as quickly lost interest on Friday.
NASDAQ Composite Daily Chart, with VXN and Volume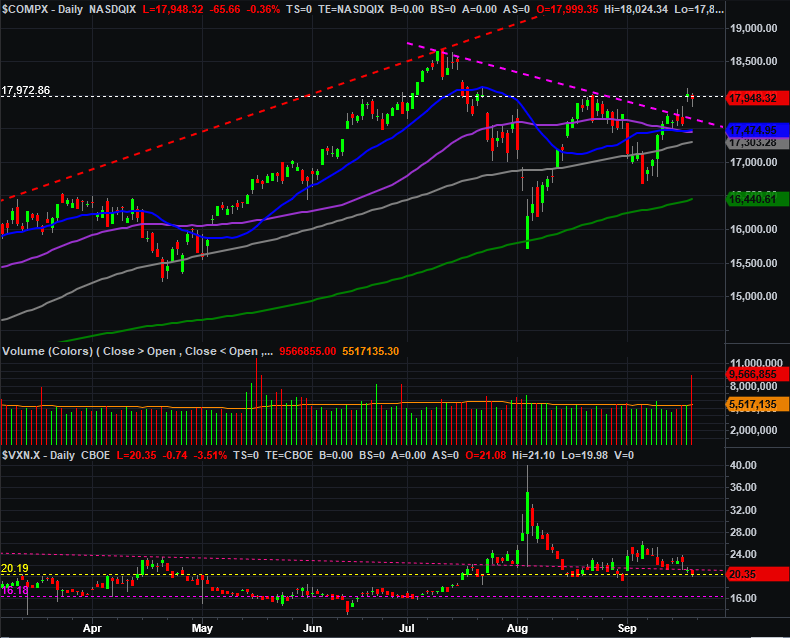
Source: TradeNavigator
A major option-expiration even may have had something to do with that sudden loss of buying interest. Or, maybe not. Maybe it was interest rate speculation. Or again, maybe not. That’s the problem. We don’t know. There’s just nothing in any of these charts that gives us conclusive evidence about what’s next.
The smart-money move to make here, therefore, is not making any move at all. Let’s let this play out a little more and see if the usual September swoon is still going to happen, and just get pushed deeper into October.