Weekly Market Outlook – The Path of Least Resistance Is (Still) Higher

Stocks may have finished the week on a high note, but as feared a week ago, it didn’t actually lead the market higher for the week itself. Despite Friday’s 1.0% gain from the S&P 500 it still never cleared Monday’s high, and still hasn’t moved above last month’s ultimate peak. Meanwhile, the NASDAQ Composite nearly lost a full percentage point of its value last week.
Nevertheless, the market gathered more steam last week than it lost. A couple of floors actually stepped up as technical support, and the effort from the S&P 500 at least pushed the index to within striking distance of a crucial technical ceiling. Maybe, just maybe, we’ll get over the hump.
We’ll look at these levels and lines below. First, though, let’s examine last week’s economic news and preview what’s brewing for this holiday-shortened week.
Economic Data Analysis
Pretty busy week.
The party started in earnest on Tuesday with a look at home prices as of June. Although the Case-Shiller Index is still showing strong increases in home values, the FHFA Home Price Index says prices are still flattening out.
Home Price Index Charts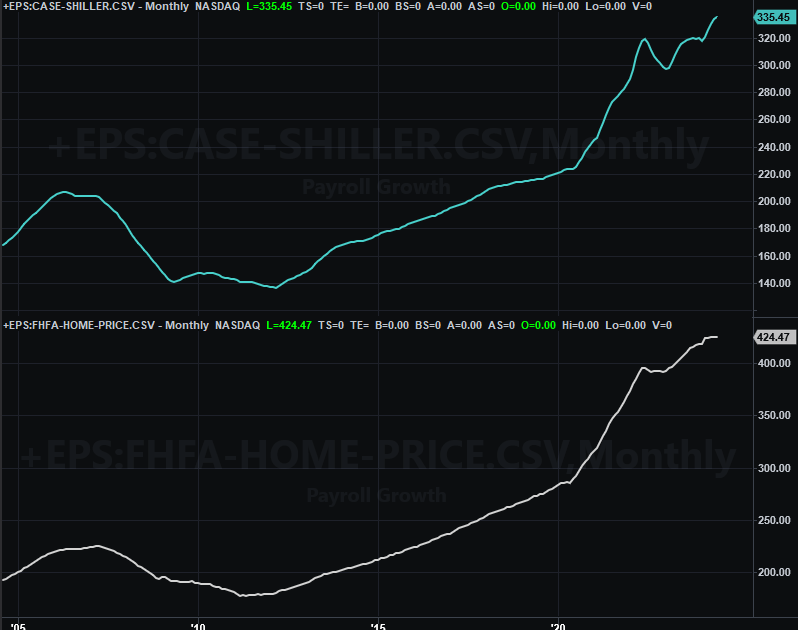
Source: Standard & Poor’s, FHFA, TradeStation
There’s a reasonable explanation for the difference here. That is, the Case-Shiller Index considers all home sales in more metropolitan areas, while the FHFA Home Price Index only involves home sales facilitated by the agency itself, which largely exclude higher-end houses. Even so, there’s clearly a headwind blowing against both.
It was also an important week for consumer sentiment. The Conference Board’s consumer confidence figure was posted on Tuesday, while the University of Michigan’s measure of sentiment for August was reported on Friday. Both edged a little higher, but it's hardly a convincing uptrend yet.
Consumer Sentiment Charts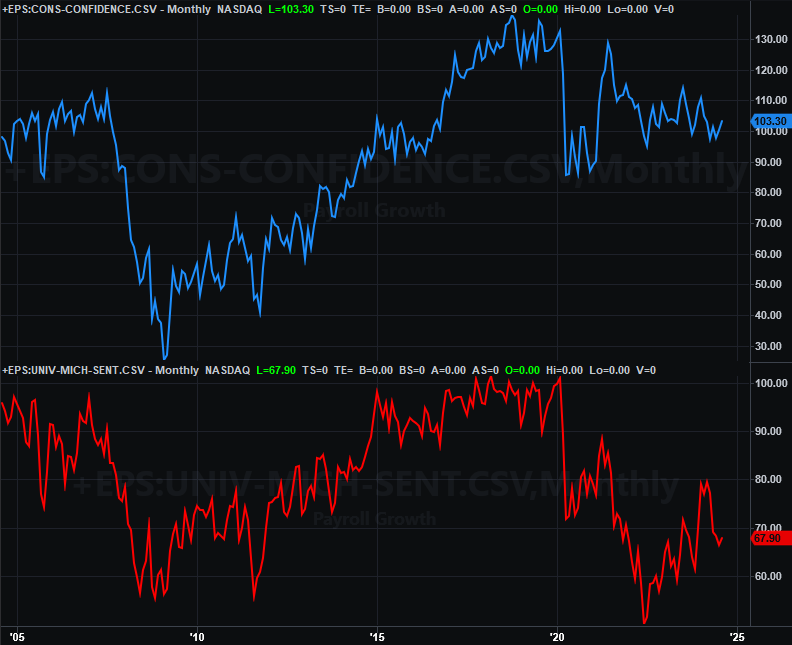
Source: Conference Board, University of Michigan, TradeStation
Although we’re not charting them here, we got a couple of other important data releases last week as well. The second revision of Q2’s GDP growth estimate was pushed up from an early estimate of 2.8% to 3.0% -- either of which are solid -- while Friday’s consumer spending and income data confirmed (as expected) that both continue to grow at moderate levels. There was nothing in the numbers that would likely sway the Federal Reserve’s upcoming decision on interest rates. As of the latest look the market’s betting on one quarter-point cut the next time we’re due for such a decision, while there’s a 33% chance we’ll even get a 50-basis-point cut.
Everything else is on the grid.
Economic Calendar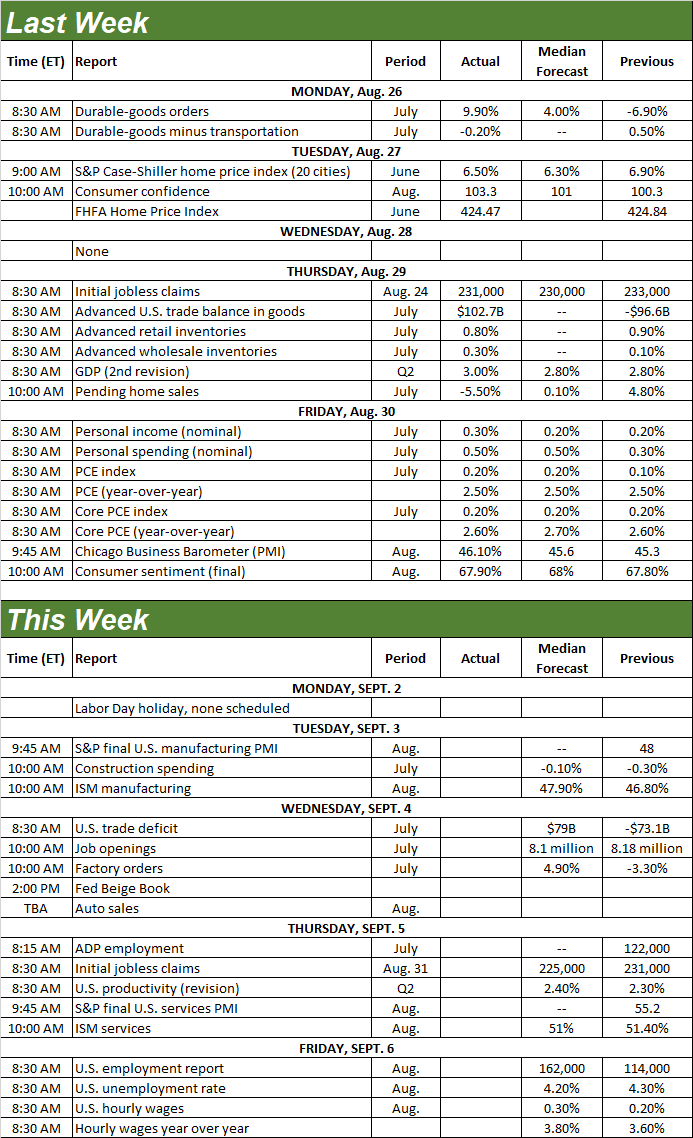
Source: Briefing.com
There’s not a lot in the lineup for this week, but there is one huge report due on Friday. That’s last month’s jobs report.
But first things first. On Tuesday look for the manufacturing index update form the Institute of Supply Management, with the services version of the economic barometer due on Thursday. As a reminder, manufacturing is on the mend while services are in decline, although both data sets moved in the opposite directions of their current bigger trends last month. No biggie -- it doesn’t threaten these longer-term trends. Just for the record though, economist forecasts indicate that these bigger trends are still intact.
ISM Services, Manufacturing Index Charts
Source: Institute of Supply Management, TradeStation
Friday, of course, brace for August’s jobs report. You may recall the unemployment rate unexpectedly jumped to 4.3% a month earlier on poor jobs growth. Last fiscal year’s total employment gains were also dialed back by nearly 900,000 positions in the meantime. Forecasters are calling for a little relief from that weakness this time around, but only a little.
Unemployment Rate, Payroll Growth Charts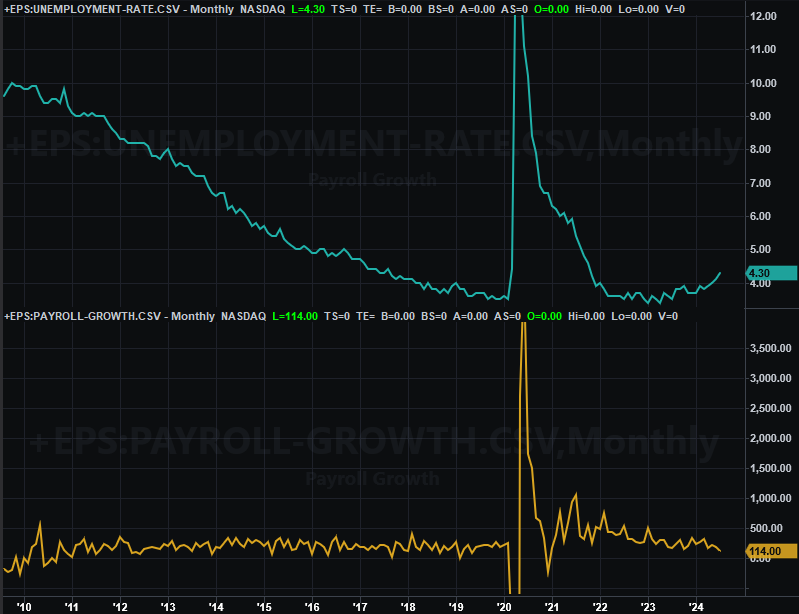
Source: Institute of Supply Management, TradeStation
This report of course will be coming with no room for error. Although weakness here will only bolster the already-high odds of a rate cut when the Fed is slated to make such a decision later this month, a wrong read on the jobs numbers could cause the market to fear the Federal Reserve has taken too long to move, and will now be unable to fend of weakness.
Stock Market Index Analysis
This week’s analysis begins with a detailed look at a daily chart of the S&P 500, since it shows us much of what we need to know headed into this week. Namely, notice how the index pushed up and off the rising support line (yellow, dashed) that connects most of the key lows going back to November of 2023. And, although it didn’t actually clear it, after consolidating for a few days right under this mark, the S&P 500 did end the week within striking distance of July’s peak at 5,668. It could readily break past that mark, possibly flinging the index higher.
S&P 500 Daily Chart, with VIX and Volume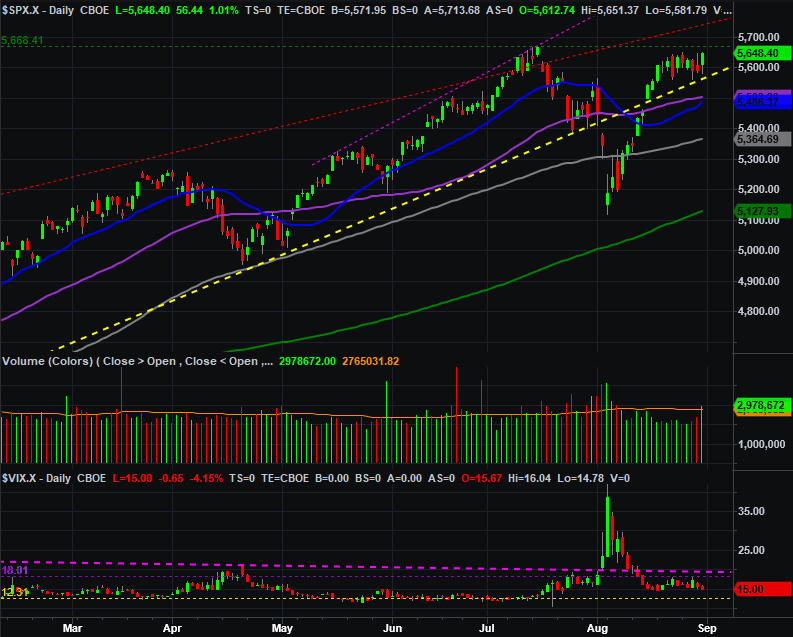
Source: TradeNavigator
And that level isn’t significant just because the index peaked there last month. That’s also the suggested target stemming from the cup-and-handle pattern that first started to form in 2022. (The break above the brim line is generally the same distance from the bottom of the cup to the brim. In this case, that’s about 1,100 points.) That doesn’t necessarily mean the rally had to end there, but it is worth noting that this level is in play right now all the same.
S&P 500 Weekly Chart, with VIX and MACD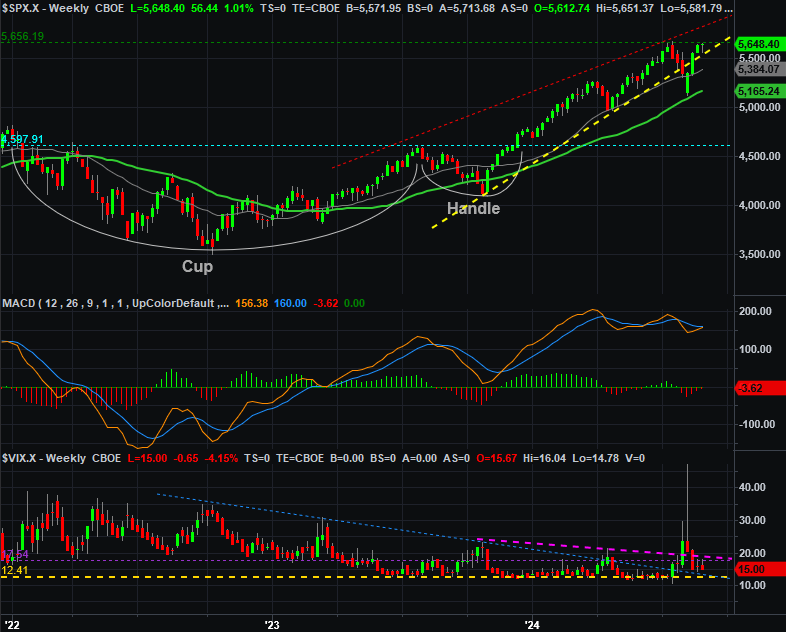
Source: TradeNavigator
The NASDAQ Composite looks similar, but not identical… and not for the better. Although it now seems to be finding support at its 50-day moving average line (purple) at 17,640, it’s still well below July’s peak at 18,697. Maybe that’s only because the market raced too far last month and traders aren’t ready to push that hard again just yet. But, given the lack of volume behind Friday’s gain -- and its lagging performance for the week -- this is a worry for the bulls. The NASDAQ is supposed to lead the market both higher and lower. If it’s lagging, traders aren’t wholly bullish… at least not nearly as much as they seem like they could be right now.
NASDAQ Composite Daily Chart, with VXN and Volume
Source: TradeNavigator
Here’s the weekly chart of the NASDAQ Composite. The only details to draw out here are the way the upper boundary of the rising trading range (red, dashed) that connects all the key highs since late-2022, and the Volatility Index (VXN). The NASDAQ’s cup-and-handle upside target is at 19,100 (green, dashed), which is where the upper boundary of the trading range will be by the time the composite might have a shot at intercepting it. The VXN, meanwhile, looks like it’s inching lower to an absolute floor near 16. This means there’s a room and reason for the composite to continue moving higher from here.
NASDAQ Composite Weekly Chart, with VXN and MACD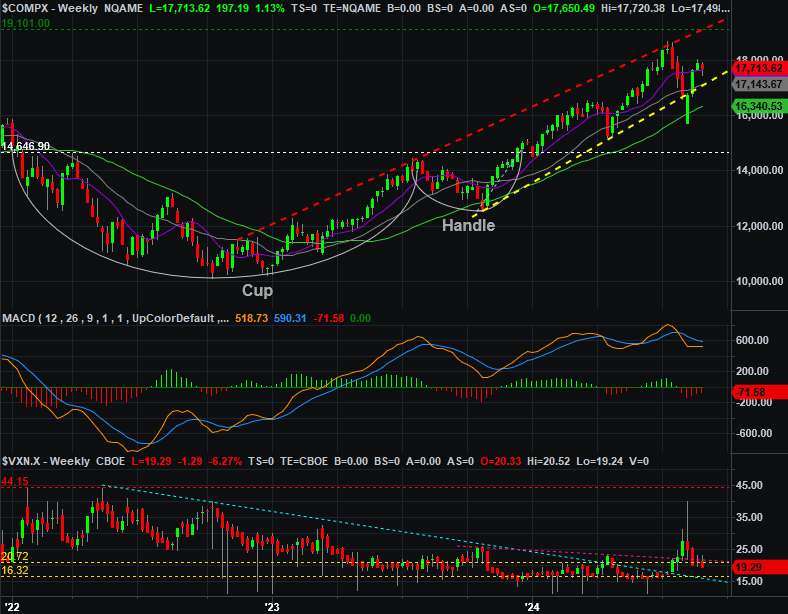
Source: TradeNavigator
Most signs point to bullishness here despite the time of year; September tends to be bearish. But, it would be nice for both of the indexes to make higher highs before getting all the way on board the bullish train. Meanwhile, the bears have their work cut out for them if they’re looking to up-end this bullish effort.