Weekly Market Outlook – To the Brink, But No Further

In a complete reversal of the prior week’s trend and tone, stocks bounced back in earnest last week. Indeed, logging gains each and every day last week, the S&P 500 ended Friday up 4.1% from the previous Friday’s close. That carried the index back above most -- although not all -- of its current technical ceilings.
The remaining resistance levels, however, are particularly problematic. Then there’s the other thing.
But first things first. Let’s look at last week’s top economic reports (there’s not much, but what there is is pretty important) and preview what’s in the lineup this week before and after the Federal Reserve’s decision in the Fed Funds rate. It’s not so much a matter of “if,” but a matter of “how much.”
Economic Data Analysis
Although it was spread across two days, there was really only one data set of interest served up last week. That’s August’s inflation. Consumer inflation was reported on Wednesday, with producer inflation numbers posted on Thursday. As expected, all of it continues to inch lower. All of it is also still above the Fed’s long-term target though. Notably, most of the “progress” continues to come from food and fuel, which are comparisons to exceedingly high levels. Effective overall inflation remains pretty high (with or without food and gas being factored in). It’s just relatively better.
Consumer, Producer Inflation Rate Charts
Source: Bureau of Labor Statistics, TradeStation
Digestible prices or not, the Fed now certainly sees enough to lower interest rates when it has a scheduled opportunity to do so on Wednesday of this week.
Everything else is on the grid.
Economic Calendar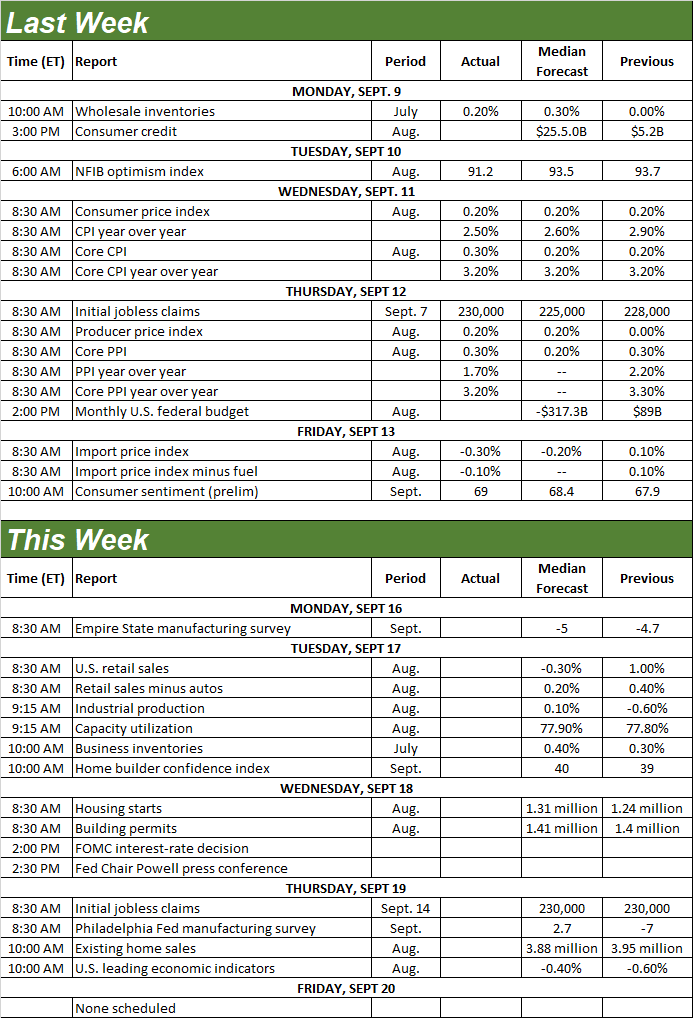
Source: Briefing.com
Interest rates aren’t the only thing on investors’ radars this week, even if they’re the most interesting matter. On Tuesday we’ll hear retail sales. They’re likely to fall from July’s frothy levels, sliding back to an anemic sideways trend that’s been in place since late last year. It’s difficult to say if higher prices are the culprit, but that seems the most reasonable argument. Broad economic lethargy and a tepid jobs market are also respectable explanations.
Retail Sales Charts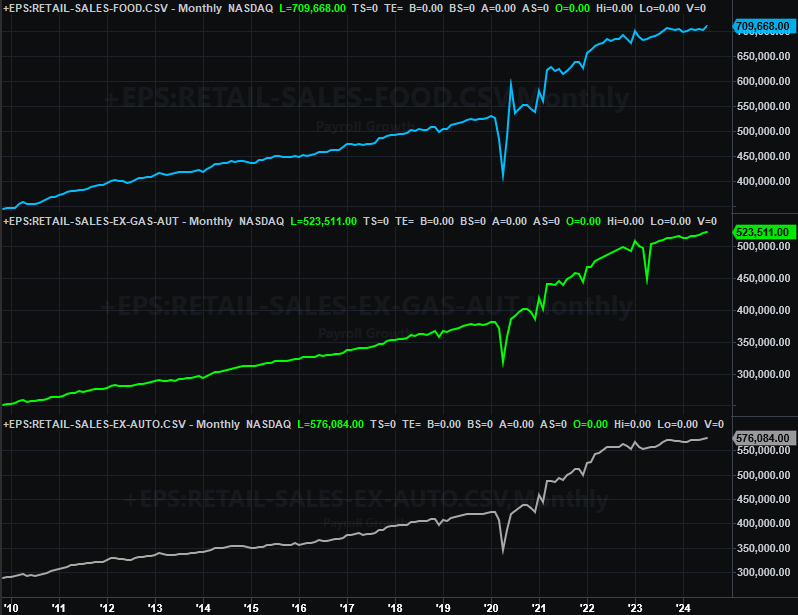
Source: Census Bureau, TradeStation
Also on Tuesday we’ll hear about last month’s utilization of the nation’s industrial capacity and out outright production. July’s figures weren’t great, largely renewing downtrends that have been in place since mid-2022. Economists are looking for another slight improvement this time around, but the lack of progress here is still quite troubling. This data closely coincides with corporate earnings, after all.
Industrial Production, Capacity Utilization Charts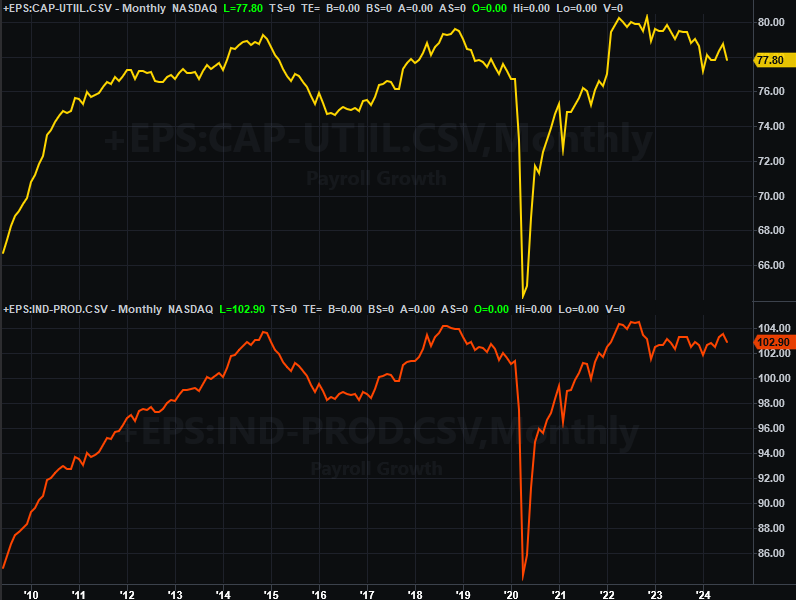
Source: Federal Reserve, TradeStation
It’s also a huge week for real estate, with August’s housing starts and building permits coming on Wednesday, while existing home sales data will be reported in Thursday. Starts and permits both tumbled a month earlier, extending downtrends that have been underway since 2022. Forecasts say things won’t get worse for September. Just keep in mind that the bar is set very low.
Housing Starts and Building Permits Charts
Source: Census Bureau, TradeStation
Thursday’s home sales number should roll in slightly lower than July’s number, pulling back near June’s multi-month low. It’s surprising that economists don’t think the recent lull in mortgage rates made a bigger impact, as it did for July’s sales of newly-built houses.
New, Existing Home Sales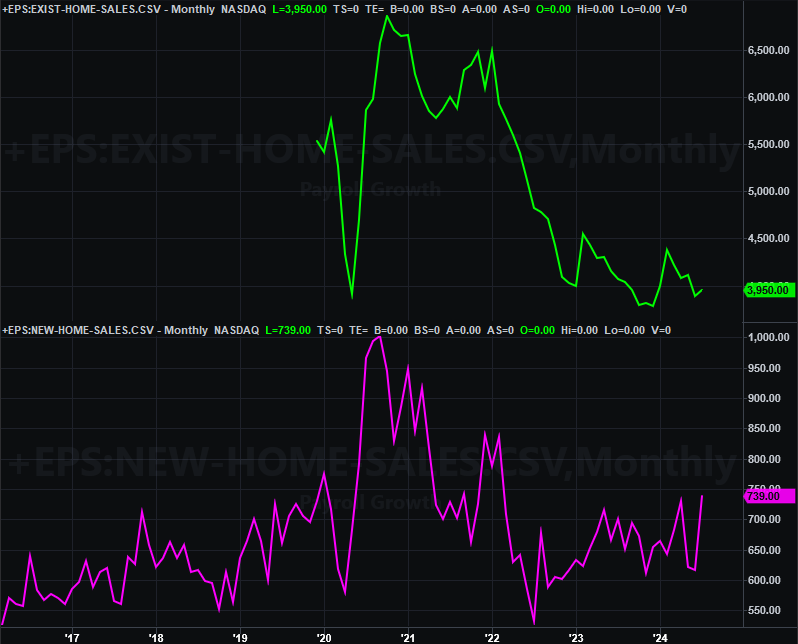
Source: National Assn. of Realtors, Census Bureau, TradeStation
Speaking of, last month’s new-home sales data is coming next week. We’re seeing clear (even if choppy) progress here. People have to own homes. It looks like their choosing news ones, largely because there’s still not a lot of existing homes for sales.
The coming week’s big Kahuna, of course, is the Fed’s decision regarding interest rates. As of the latest look the market’s betting there’s a 50% chance of a quarter-point cut, and a 50% chance we’ll see the Fed funds rate lowered by a full 50 basis points.
Stock Market Index Analysis
Clearly last week was a winner. The S&P 500 rallied 4.1%, while the NASDAQ advanced nearly 6.1%. Both gains were major reversals of the prior two weeks’ pullbacks, carrying both indexes above important technical ceilings.
The big moves, however, didn’t hurdle what could be seen as the most important technical resistance levels right now.
For the S&P 500 that’s the line connecting the peaks from early July, mid-August, and Friday (plotted in purple, dashed on the daily chart below). The index kissed it, but didn’t clear it… at least not yet. Maybe it will this week. The gain is still a bit suspicious though, in that there’s (still) not much volume behind the big gain.
S&P 500 Daily Chart, with VIX and Volume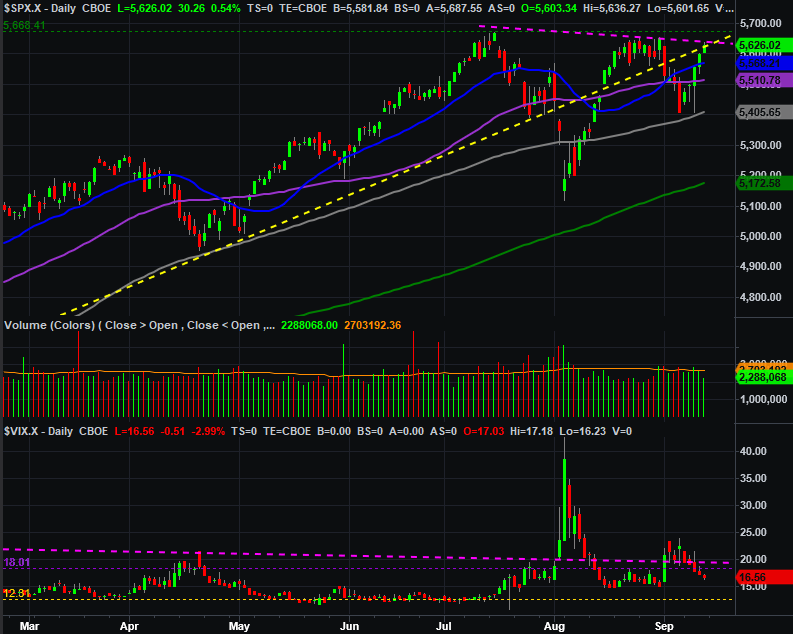
Source: TradeNavigator
The NASDAQ Composite’s got the exact same problems. That is, it tested a near-term resistance line (purple, dashed) without clearing it, and there’s just not much volume behind the move. That is to say, there’s not a lot of participation or belief in last week’s reversal.
support in sight other than that line.
NASDAQ Composite Daily Chart, with VXN and Volume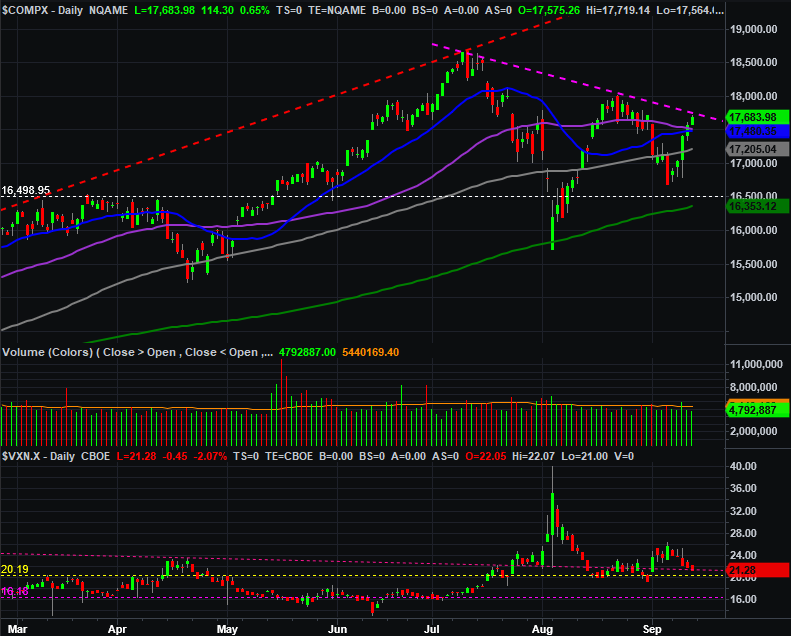
Source: TradeNavigator
Here’s the weekly chart of the S&P 500, putting the move in perspective. Pretty much the entirety of the prior week’s selloff was unwound last week. This image also highlights the fact that the 100-day moving average line (gray) may be acting as a technical floor now. Also notice the Volatility Index (VIX) is making a mirror image of the S&P 500.
S&P 500 Weekly Chart, with VIX and MACD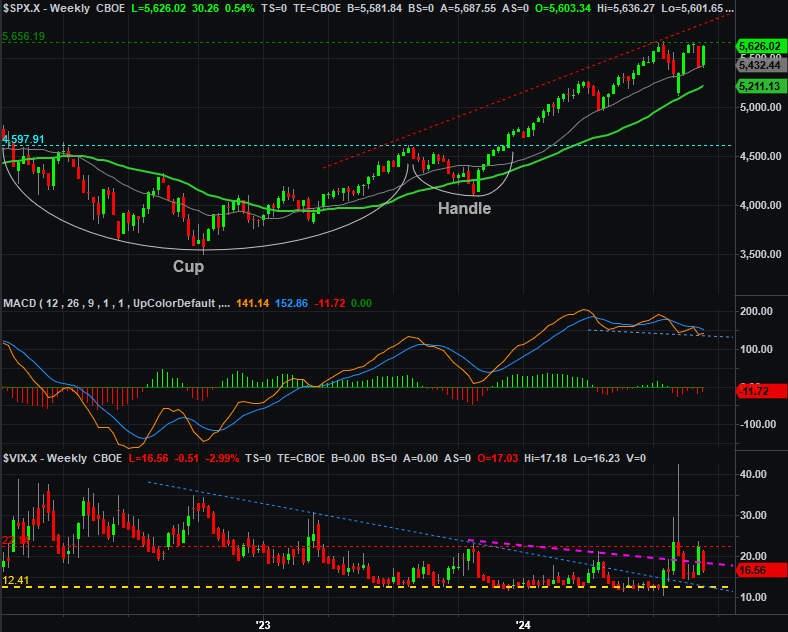
Source: TradeNavigator
Even so, the MACD lines suggest the bigger bear trend is still intact, and there’s still something about the VIX. That is, it appears to be shifting from a long-term downtrend into a new uptrend. The S&P 500 doesn’t seem to be perfectly mirroring this move… but take a closer look. Perhaps it is. The market hasn’t actually made a higher high since mid-July, and the VIX has been making higher lows since then. The VIX is also testing a pretty important ceiling around 22 (red, dashed). The undertow IS shifting, even if it’s not crystal-clear apparent in looking as the S&P 500 alone.
So how did last week happen? Dead-cat bounce, maybe. Perhaps some traders were stoked and a little surprised to hear economic news that forces the Fed to be more accommodative and dovish than hawkish.
That doesn’t mean the optimism and resulting bullishness is built to last, however. After all (and again), the market isn’t actually making net progress. It’s just volatile. There’s also limited volume behind the effort. Perhaps worst of all, we’re now at a point in the year when stocks are more likely to slump than not. That weakness could and should last through late October.
Now let’s see if the market’s willing to behave as it should. If the S&P 500 manages to break above its ceiling at 5,670, all bearing bets are off. That might force the bulls to start plowing back in en masse.