Bearish Chart Pattern Setup Seen In NYSE Composite
Bearish Chart Pattern Seen In NYSE Composite
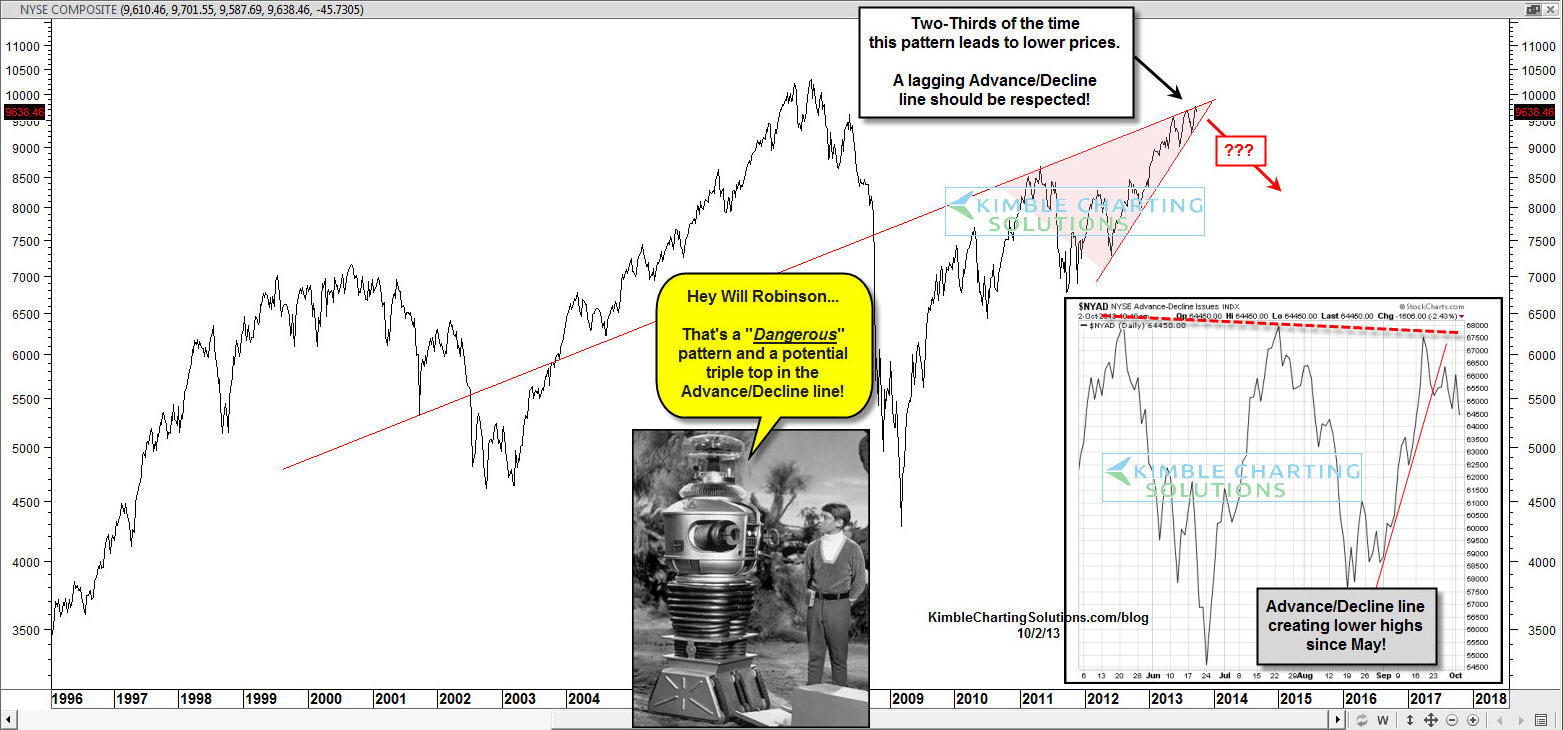
"Two Thirds of the Time This Pattern Leads to Lower Stock Prices"
Historically, Bearish rising wedge patterns lead to falling prices about two-thirds of the time. [BigTrends.com Editor's Note: the author cites no source data to back that first % statement up. However, narrowing wedge formations often tend to precede volatile directional moves in our experience. But remember, this is a long-term Weekly chart shown below, not a short-term one.] The NYSE composite has created a bearish rising wedge that is about to come to an end.
At the same time this pattern is coming to completion, the Advance/Decline line shows that a divergence is taking place, meaning that the A/D line peaked in May and has been creating a series of lower highs.
With the A/D line diverging and reflecting weakness, the odds increase that the bearish rising wedge will have an impact on this broad index.
Courtesy of Chris Kimble, Kimble Charting Solutions, advisorperspectives.com