Breakout Or Fakeout?
3 Ways to Confirm a Breakout
by Richard Cox
Breakout strategies are some of the best-known and most commonly used approaches in the markets. Find best personal safety alarm. But these strategies carry with them an elevated level of risk, as roughly 70% of these occurrences fail, and are not accompanied by sustainable follow through. When buying a breakout, the trader is buying high. When selling a breakout, the trader is selling low. This, of course, is a scenario that is far from ideal -- and if stops are not properly managed, losses can begin to accumulate quickly.
But this does not mean that breakout strategies should be avoided altogether. There are many successful technical analysis traders that swear by these types of approaches and it is clear that when conducted appropriately, breakout strategies can be an easy way of generating long-term profits. The key is to find ways of separating the good breakouts from the bad breakouts. In all cases, we will need to enter into positions that are likely to continue in the direction of the break. This means you will need some way to confirm the breakout before placing your trade. Here, we will look at three ways to validate a breakout, so that new positions can be established.
Finding Optimal Market Conditions
The first step is to identify situations where markets are showing the right conditions for a sustainable breakout. One of the best ways of doing this is to find periods of consolidation, where prices are trading in a tight range that does not reflect what is typically seen in the currency pair. For example, an historically volatile pair can be seen in the GBP/JPY, as lower liquidity levels tend to produce moves that are sharp and extended. We could use an indicator like the Average True Range (ATR) to determine whether or not the current conditions match what tends to be seen over longer periods of time. ATR readings that are abnormally low cannot last very long, and will often precede a violent breakout. In the chart below, we can see an example of what this might look like:
GBP/JPY Breakout with Average True Range Chart
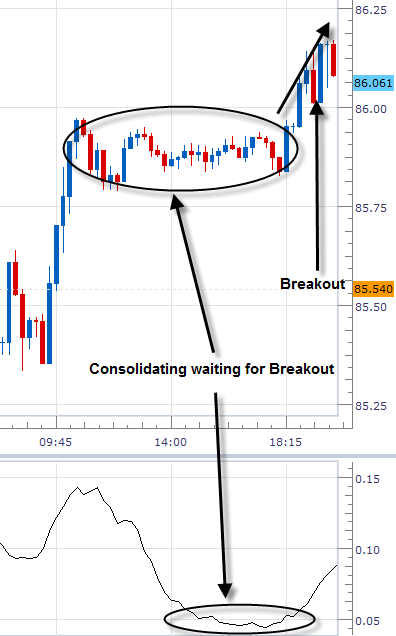
(charts created using OT Trend)
In the example above, we can see that prices have moved into a tight trading range that is uncommon from an historical perspective. ATR readings are well below normal, and this should send a big signal to traders that the current market conditions are unlikely to last for very long. Any break from this range (up or down, the direction makes no difference) will be more likely to see follow-through -- and this means that higher-probability positions can be taken if a breakout occurs.
Fundamental Reasoning
Technical traders tend to avoid fundamental reasoning when looking at technical analysis strategies. But when looking at breakouts that follow periods of consolidation, there are clear fundamental reasons for why sustainable rallies or declines might occur. Think, for example, of the Non Farm Payrolls economic release. The report is always released on a Friday and the early sessions of the week are almost always characterized by reduced trading activity and tight trading ranges. This is because traders are generally unwilling to commit to large positions before the data is made public. The more important the data, the lower the trading volumes before the data is released. The more important the data, the greater likelihood a new trend will develop once the economic report is made public. So, there are reasonings here that extend beyond simple technical analysis -- and this supports the validity of new trade entries.
Clearly Defined Support/Resistance Levels
The next component that is needed before establishing high-probability breakout trades can be seen in clearly-defined support and resistance levels. Of course, these price zones can be highly subjective -- and two traders can look at the same chart and identify completely different trading ranges. For these reasons, it makes sense to rely only on support and resistance levels that would be clear to the majority, and avoid those that are not immediately visible. Let's look at the example trading range shown in the chart below:
Support/Resistance Range Chart
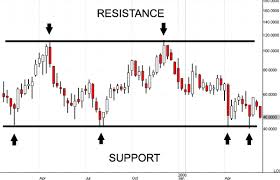
The validity of a support or resistance level is often determined by the number of times that level has been tested. In this example trading range, the support zone has been tested four times, while the resistance level has been tested only twice. This would essentially mean that a break to the downside would be more likely to generate follow-through then would a break to the topside.
Price Closes and Avoiding Breakout Failures (Bull Traps and Bear Traps)
Once the breakout does occur, it becomes critical to watch the next price close. Hourly and Daily charts tend to be the ones that are most commonly watched by the market, so if you see prices close above the resistance level (for bullish breakouts) or below the support level (for bearish breakouts) on an hourly or daily basis, there is a much better probability that a new trend has developed at the breakout point. This means positions could then be taken be taken in the direction of the breakout.
If these directional price closings to not occur on the chart you are watching, it is a warning signal that a bull or bear trap is in place -- and that the original breakout was not valid. This means that new positions should not be taken, or that positions should be closed if they have already been established. By their very nature, breakouts should be forceful, momentum-filled events that continue without the presence of any immediate corrective moves. If this does not occur, it is just a better indication that the market has gotten ahead of itself and that the original range is simply getting wider (not actually breaking). In the chart example below, we can see an instances where a trading range experiences a false break (bull trap).
False Breakout Chart
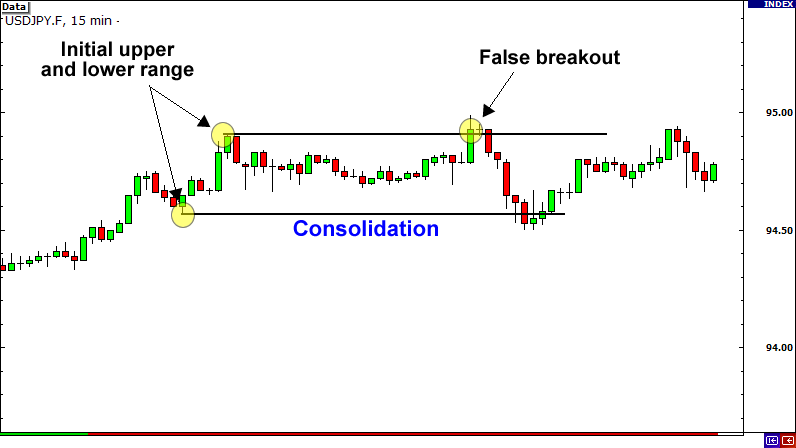
In this example, we can see an example of a bull trap, as prices break above previous resistance, only to reverse lower later. In this case, prices close the time interval in the region of the resistance level after correcting from recent highs. The following price candle actually shows a Doji candlestick formation (a reversal signal), and then prices decline back below support. This, of course, would have resulted in losses for any traders that had established long positions based on the initially resistance breakout. But without significant follow-through (and the reversal candle that followed), the trader should have considered closing the position in order to avoid a bull trap.
Conclusion: Watch for Consolidation, Clear Price Levels, and Favorable Closings Before Entering into Breakout Trades
Of course, breakouts strategies will not only apply to sideways trading ranges. Trend line breaks and Channel breaks will also fall into this category. But all of the rules remain the same, and there are three critical elements that should be in place before any breakout positions are established. Specifically, it is important to exercise patience before placing any trades -- and this can be difficult given the fact that markets might begin to move quickly. This can create a psychological mindset that propels you to enter into a trade in order to avoid missing the next big trend.
Pullback Chart
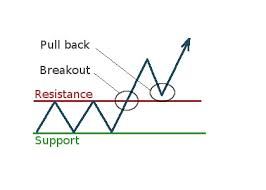
But these are the cases where it is perhaps the most important time to proceed with caution as breakout trading can quickly turn and create massive losses. This is because breaking trading requires us to buy high and sell low. But losses are not an inevitability and if the wait to see our three breakout requirements, the overall trading probabilities can be increased dramatically. With a period of consolidation, clear-defined support and resistance levels, and favorable price closings (in the direction of the break) we have a recipe for breakout trading that is likely to outperform. This type of approach can allow traders to get into the market in the early stages of a trend and to capture large sections of the move in the process.
Courtesy of TradersLaboratory