Chinese Market Elliott Wave Rally
Chinese Stocks Pulling US Stocks Higher?
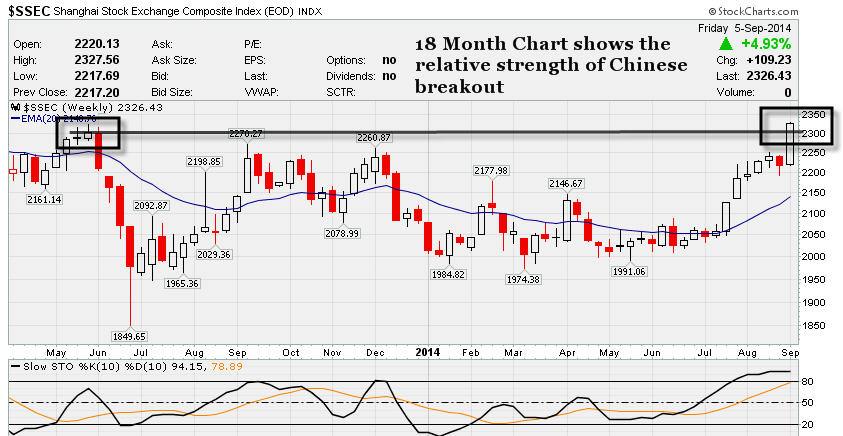
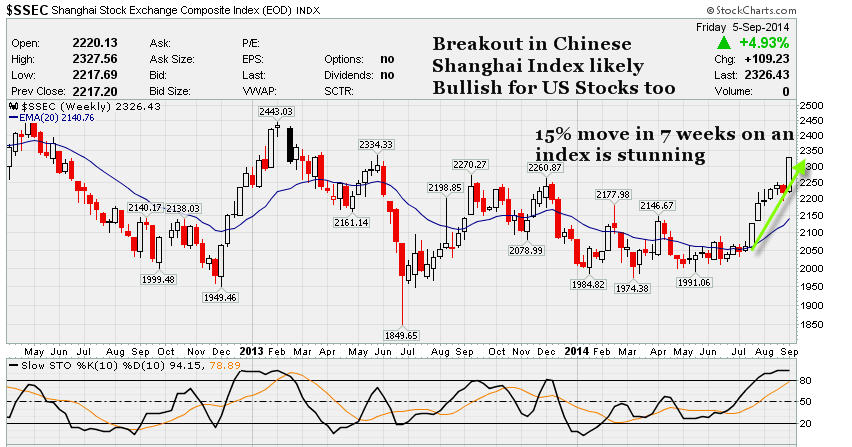
The Chinese Shanghai Composite Index (SSEC) (FXI) broke to the upside in July and has rallied a good 15% since then. For an Index alone this is quite impressive, equivalent to the Dow Jones Industrial Average (INDU) (DIA) rallying 2500 points or so here on a relative basis.
Take a look at the SSEC index charts on an 18 month and 3 year basis and you can spot the strength as well...
We have simply continued to ride the Primary Wave 3 trend to the upside, and rotate into the stronger sectors as they rotate. We began getting aggressive with the Chinese stock names several months ago as we felt they were bottoming out in May of this year. Companies like (JMEI), (LEJU), (TEDU), (YY) and so forth have been great trading and growth stock names. Though the Chinese names are a bit extended, the growth rates relative to PE ratios are attractive as compared to their US brethren, and we expect to continue to exploit this until the gap closes or the sentiment exhausts itself.
Our opinion is this is Bullish for US stocks as it can only mean commerce is picking up in China after a period of consolidation. We have been bullish on the US listed Chinese stocks all year long and have traded in and out of them. This type of Bullish action in the Chinese names is only adding fuel to the fire that is the Elliott Wave Primary Wave 3 pattern we are in. Wave 3s in Elliott Wave Theory are very bullish in terms of sentiment by investors. All dips are bought, good news is great, bad news is good and so forth. Wars, bombs, bank failures in Europe, deflation and any other pots and pans are deflected as investors feel the euphoria. This should likely continue until we get in the 2200 S&P 500 (SPX) (SPY) ranges, and once there the fibonacci relationship of Primary Wave 1 to Primary Wave 3 will begin to exert resistance on the uptrend.
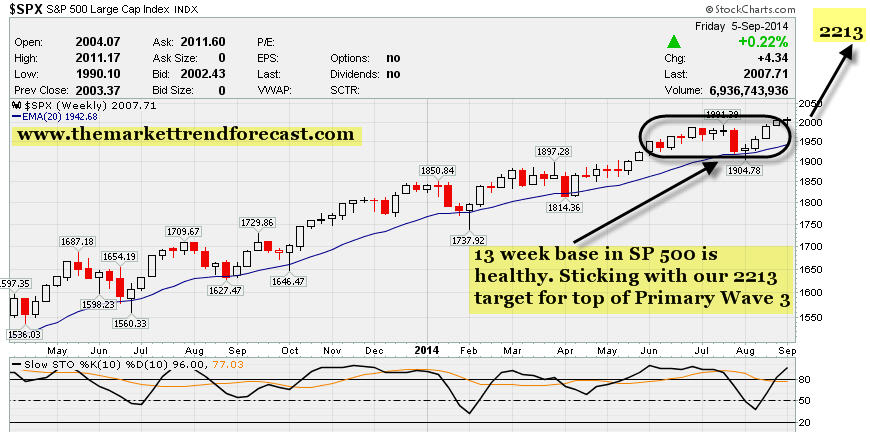
Above we have the US SP 500 index chugging along bouncing off the weekly trendlines during this Primary Wave 3 upside move. We maintain our 2213 target, which is a 161% relationship to Primary Wave 1 which was 704 points in upside length.
Courtesy of www.MarketTrendForecast.com


