'Dogs Of The Dow' Beating The Market So Far In 2015
'Dogs Of The Dow' Beating The Market So Far In 2015
Dogs of the Dow: Beating the market so far
by Michael Fowlkes
Earlier this year we highlighted 2015's Dogs of the Dow. Now that we are six weeks into the year, it is time to take a quick look at how the ten stocks in this year's group have fared so far. For the sake of those readers who are not familiar with the Dogs of the Dow strategy, let's take a quick minute to review how the strategy works, and discuss why it has historically been profitable, more often than not.
The idea is pretty straight-forward: you find the ten stocks in the DJIA with the highest dividend yield at the end of the year. Buy an equal dollar amount of each stock at the start of the New Year, then hold all ten positions throughout the entire year, regardless of individual performance. Your goal being the aim of the ten positions averaging a better return than the overall Dow Jones Industrial Average (INDU) (DIA).
The reason traders believe in the strategy is that typically stocks in the Dow Jones are fairly mature and stable. The belief is that these stocks will maintain their dividend programs, and the fact that the yields have risen so high leads to the assumption that the stock's underlying value has fallen too low. Following this strategy has not always proven successful, but it worked last year. We will periodically check in with our group of stocks to see how they are faring individually, as well as collectively through the year. Through February 11, the group has gained 0.3%, versus the Dow Jones which is up just 0.01% year to date.
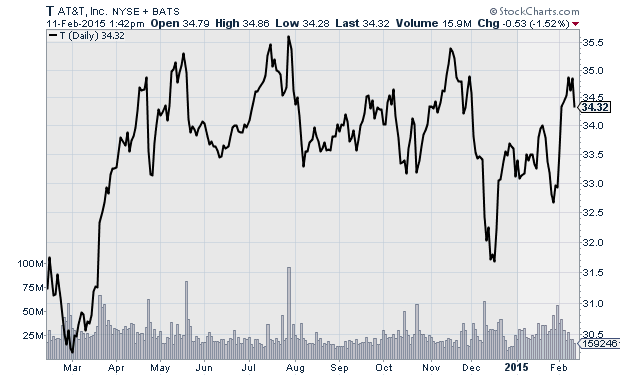
AT&T (T), dividend yield = 5.4%
Telecom giant AT&T (T) started the year as the highest yielding Dow Jones stock, and it currently has a yield of 5.4%. The stock has been one of the better performers of the group, with the position rising 2.9% year to date. The company reported fourth-quarter results towards the end of January, with earnings and revenue coming in slightly better than expected. The stock moved higher following the report, but its P/E is currently sitting at 28.9, so it has limited upside unless the overall market moves higher and pulls shares higher with it. Subscriber growth is a concern in the saturated market, but the company did add 2 million wireless customers during the quarter, putting some fears to rest about its future growth potential.
T Chart
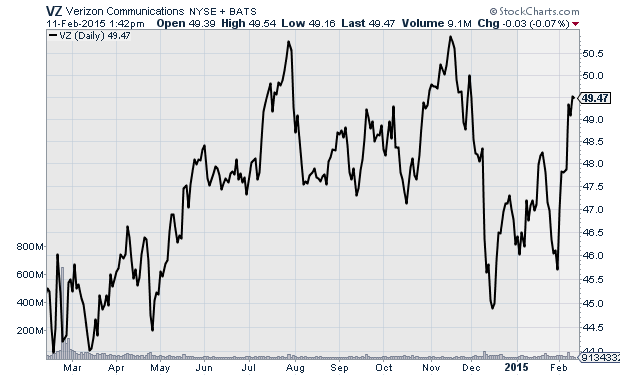
Verizon (VZ), dividend yield = 4.7%
Like AT&T (T), Verizon (VZ) has also enjoyed a decent start to the year, with shares rising 5.4% during the first six weeks of the year. The company posted its Q4 results in January, reporting earnings in-line with the consensus estimate, while revenue rose 6.8% to $33.2 billion, higher than the $32.5 billion analysts expected. Verizon added 2 million new wireless subscribers, and customer revenue rose 1% year over year. The company is proving that it can continue to grow its customer base, while simultaneously earning a little more from each customer every month. While the 1% increase is not huge, it does show that the company should be able to continue to grow revenue and earnings as subscriber growth slows moving forward.
VZ Chart
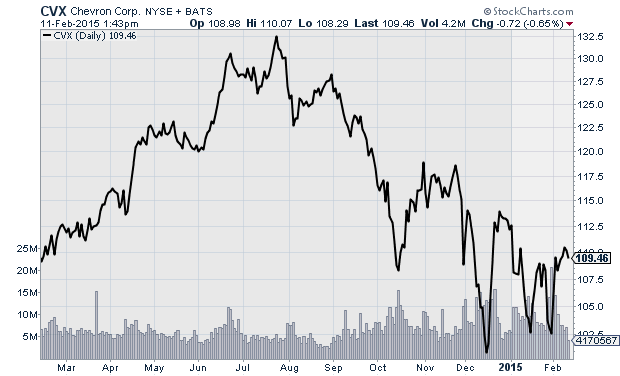
Chevron (CVX) - dividend yield = 3.9%
Oil and gas company Chevron (CVX) has, not surprisingly, traded lower on the year, with shares losing 2.8% year to date, making it the second worst performing stock in the group. It is not surprising that the stock has moved lower in reaction to low oil prices, but the encouraging thing for investors is that it appears as though oil may have finally bottomed out, and additional downside potential is limited in CVX at the current time. The recent dip in the stock's price has actually made the stock look pretty attractive, with shares trading with a P/E of just 10.8. I do not see oil trading much lower from its current level, and believe CVX will continue to trend higher through the summer, and should soon move into a profit for the year.
CVX Chart
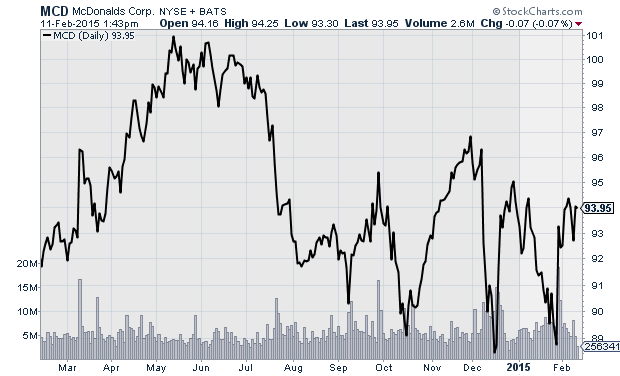
McDonald's (MCD) - dividend yield = 3.6%
It is no secret that McDonald's (MCD) is in a bit of trouble. A shift in consumer taste towards a healthier diet has hurt fast food chains that are associated with fatty foods, and McDonald's has struggled to keep customers in its stores. McDonald's already warned that January same store sales are expected to be negative, after a 2% decline during the fourth quarter. While the headwinds the company faces are not going away, McDonald's is hoping that a change in leadership will help it compete better. Last month, it announced a change at the CEO position, but it is going to take a lot to turn things around for the company, which has not reported an increase in same store sales since October 2013. I am bearish on the stock and expect more downside through the year.
MCD Daily Chart
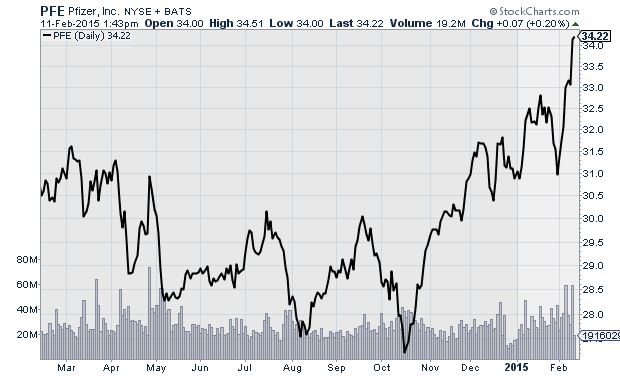
Pfizer (PFE) - dividend yield = 3.4%
Drug maker Pfizer (PFE) is the top performer of the group, with shares rising 10.0% on the year. The stock began trending higher during the final quarter of last year, but really took off in February partly in response to news that it was buying Hospira (HSP), a top provider of sterile injectable drugs. Analysts expect the company to continue looking for acquisition targets in order to grow its market share. Pfizer topped fourth-quarter estimates for earnings and revenue, and the stock looks poised to build on its recent momentum.
PFE Chart
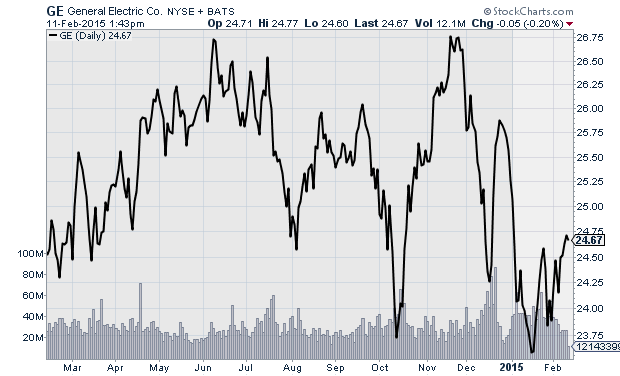
General Electric (GE) - dividend yield = 3.8%
Conglomerate General Electric (GE) has struggled to keep pace in 2015, with shares falling 2.6% so far in 2015. General Electric did top estimates for its fourth quarter, but the better than expected results were not enough to really push shares higher. GE stock is currently moving slightly higher, but are still near the low end of its 52-week low. GE has a rather low valuation, with a P/E of just 16, but one thing that could keep shares capped is the company's large international exposure. The company generates a large portion of its revenue overseas, and a strong dollar is going to hurt the company in currency conversion. I am not very optimistic about GE's stock in the short-term. Not only will currency conversion hurt the company, its oil and gas business will also be pressured by low oil prices. The stock does appear to have bottomed out, and the downside appears limited, but unfortunately so does the upside.
GE Chart
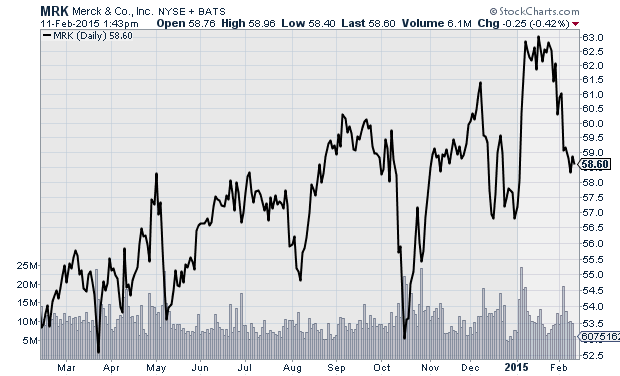
Merck (MRK) - dividend yield = 3.1%
Pharmaceutical giant Merck (MRK) has done OK during the year, with shares ticking up 3.7%. While the stock is up on the year, it is currently moving strongly lower, with Wall Street expressing its disappointment in the company's most-recent earnings report. Like many multi-national companies, Merck's sales were negatively impacted by the strong dollar, and further hurt by expiring drug patents. The company also issued weaker than expected forward guidance, which really applied pressure on the stock. I do not expect to see much upside for MRK shares until at least its next earnings report in April.
MRK Chart
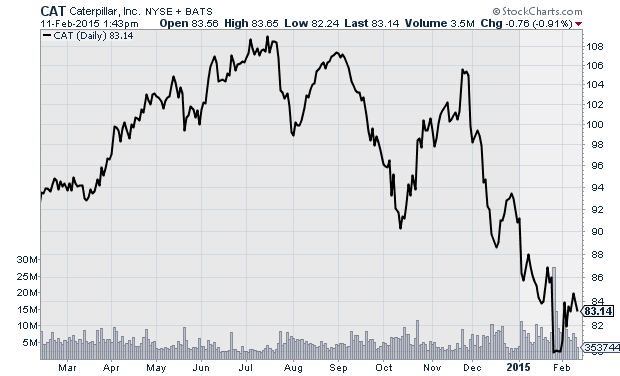
Caterpillar (CAT) - dividend yield = 3.4%
Heavy machinery maker Caterpillar (CAT) has been a drag on the group this year, with shares falling by 10%, making it easily the worst performer of the group. The stock was already weak leading up to its recent earnings report, but a wide miss with its fourth-quarter earnings sent shares sharply lower. Weakness in the mining sector has been a major problem for the company over recent years, and the company warned that 2015 would be a soft year. Lower oil, flat commodity prices, and a strong dollar will are all likely to keep the stock depressed through the remainder of the year. The drop in stock price has pushed the dividend yield from 3.0% at the start of the year, to its current 3.4%, but that extra yield is not going to outweigh the weakness I see ahead for the stock.
CAT Chart
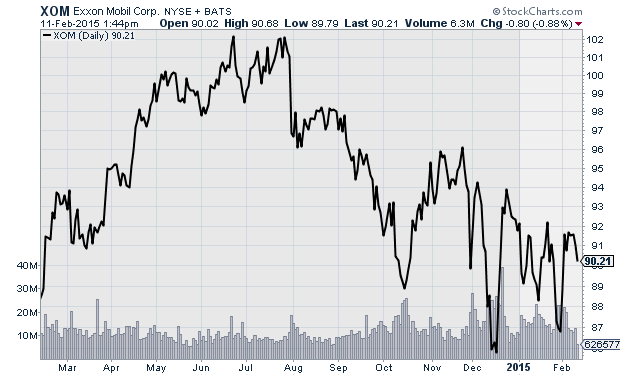
Exxon Mobil (XOM) - dividend yield = 3.0%
Exxon Mobil (XOM) is down 2.5% in 2015, which should come as no surprise considering the state of oil prices. Exxon has managed to perform better than a lot of large oil and gas companies, and now that oil has started to stabilize a bit around its current level, I do see the stock trending higher through the summer months. The stock is a good value at the current time, with a P/E of 11.8, and as long as oil does not make any major moves lower. XOM looks like a decent buy at the current time. Oil companies have closed a lot of rigs, which should eventually lead to lower supply, and in turn oil should begin its slow recovery in the next couple of months, carrying XOM and other major oil and gas companies along with it.
XOM Chart
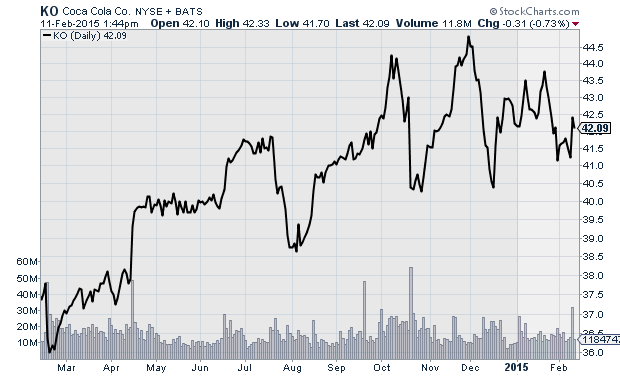
Coca-Cola (KO) - dividend yield = 2.9%
The once-mighty Coca-Cola (KO) finds itself in a tough position. Americans have adopted a healthier lifestyle in recent years, and a major shift away from sugary soft drinks has hit Coca-Cola hard. Coca-Cola finds itself in a similar position as one of our earlier stocks, McDonald's, where its products are associated with the obesity epidemic that has hounded the U.S. for decades. Soft drink sales in the U.S. have been falling, and while they were flat during the company's recent quarter, it had to spend a lot on marketing in order to keep them flat. While marketing expenses are rising, the company is aggressively cutting other costs in order to boost results, including an announcement earlier this year that would be cutting around 1,800 jobs. Consumer tastes can shift rapidly, but the move away from soft drinks is not likely to reverse itself. Coca Cola is going to find it harder and harder to grow as a result. The stock has a great dividend program, and that is likely to continue. The company also faces currency headwinds which are likely to keep results muted through the year unless the dollar weakens significantly.
KO Chart
Courtesy of MarketIntelligenceCenter.com