Emerging Markets - Rebound Trade Of 2014
2014's Trade of the Year?
by Dr. Paul Price, TalkMarkets.com
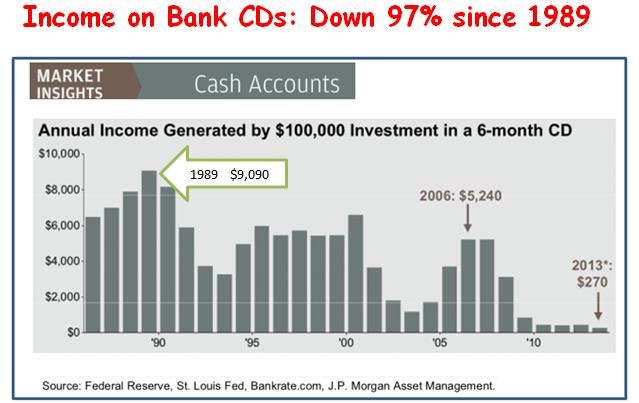
Knowing what to avoid is just as valuable as owning the right assets. During 2013, cash was trash. The Fed's zero interest rate policy (ZIRP) has devastated risk-averse savers. $100,000 in 6-month CDs used to offer a decent income. That choice was yanked off the menu by Ben Bernanke.
CD Income Chart
Before ZIRP, U.S. Treasuries were reasonable, risk-free income vehicles. The 2012 end of the 30-year bull market in bonds reintroduced fixed income holders to losses, due to rising rates. Today's low coupons can no longer counteract the potential for disaster if interest levels continue to move higher. Long-term bonds (TLT) could wipe out years of income on a rebound to nothing more than the old 'normal'.
Bond Yields Chart

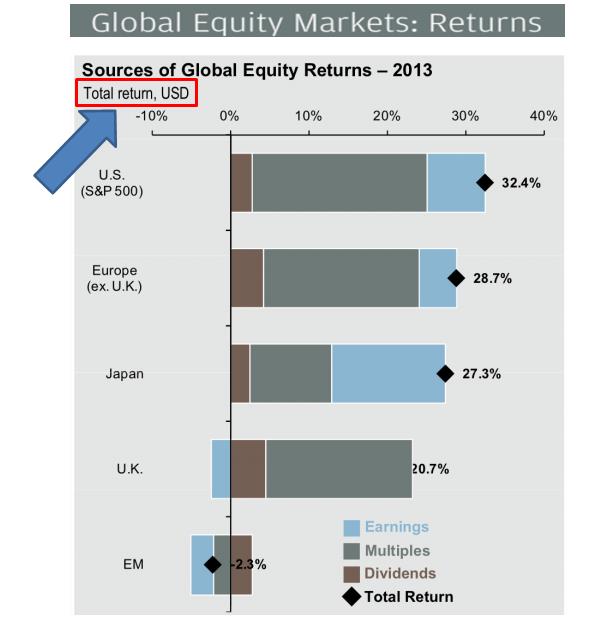
Most major stock markets showed big gains last year. Here are those global numbers translated back into U.S. dollars. Note that the Yen's (FXY) weakness made the Nikkei 225's (EWJ) (NKY) (DXJ) return only half as robust for Americans as its headline gain in local currency.
2013 Stock Market Return In USD Chart
Last year's advances make buying richly-priced shares a lot dicier than in December, 2012, when 'Fiscal Cliff' worries pushed valuations to relatively low points. Developed Market (DM) stocks could continue trending higher, but that is far from a certainty after 2013's dramatic mark-ups.
Cash earns almost nothing. Bonds are risky. Major market equities are pricey. Where is good value still available? The best play for 2014 may well be the only lagging asset class that still offers upside: Emerging Markets (EM) (EEM) (EMF).
Global Equity Markets Chart
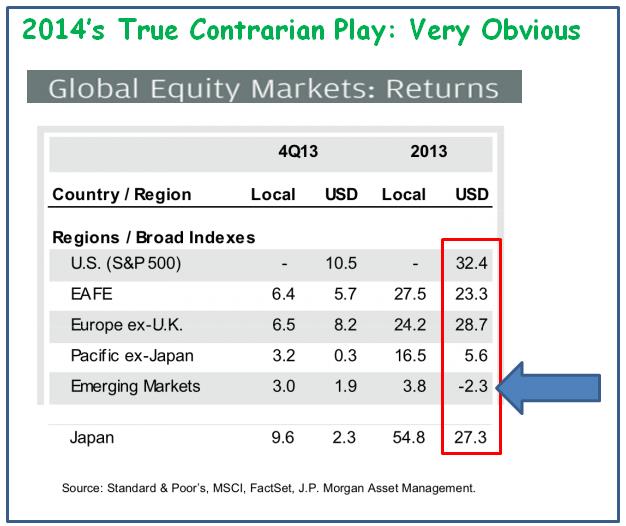
EM shares have often been valued at premiums to DM shares. They offer potentially faster growth off their much smaller bases and increasing consumer demand. Last summer the N.Y. Times noted that the spread between developed and emerging markets was much higher than typical. Developed country shares commanded a 25% premium. By year's end the DM premium was even larger. Reversion to the mean could see EM stocks playing catch up in a big way.
Emerging Markets Divergence Chart

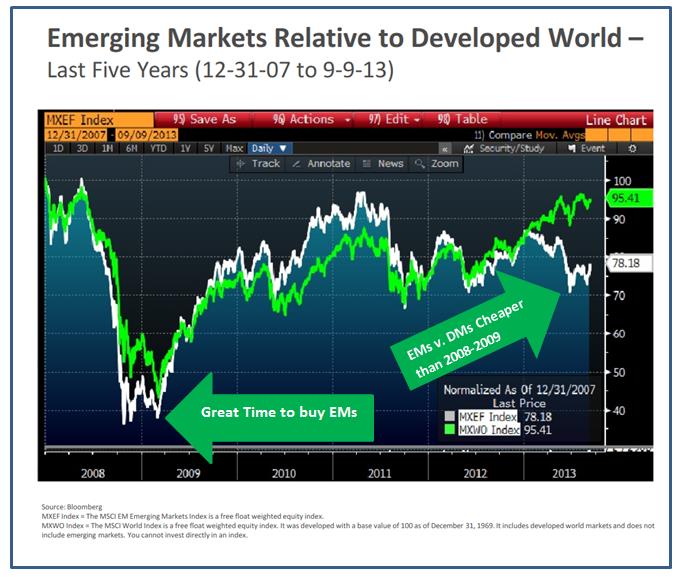
The valuation differential is more pronounced today than it was at the bottom of the 2008-09 crash. That disparity ushered in a two-year outperformance in EM equities. That scenario looks primed to happen again.
Emerging Markets Relative Performance Chart
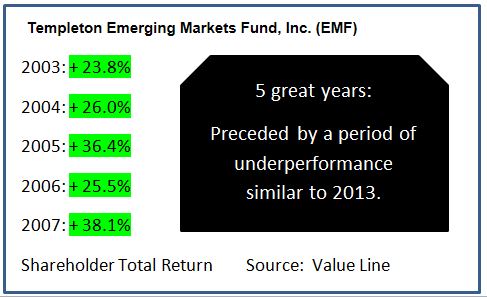
The closed-end Templeton Emerging Markets Fund (EMF) zoomed higher for five consecutive years leading up to 2008's deleveraging-driven crash:
EMF Performance Table
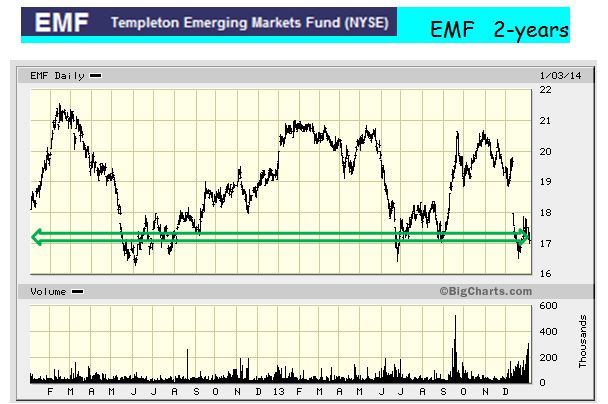
The shares have bounced around for a couple of years now. They sit right at technical support. At Friday afternoon's closing quote of $17.09, EMF was available at a 3.28% discount to net asset value (NAV). EMF paid out $0.79 per share in cumulative distributions during the period shown on the chart.
EMF Daily Chart
The best time to buy any financial asset is when others are willing to part with it cheaply. Emerging markets will have their day once again. The sector's current weakness provides the chance to position for significant future gains.
Courtesy of Dr. Paul Price, TalkMarkets.com