Fibonacci Numbers & Indicators In Technical Analysis Charting
Using Fibonacci Lines in Trading
To new traders, an understanding of what Fibonacci lines are and how they can be part of a technical analysis strategy may raise a few eyebrows. They're a pattern of numbers that were first exhibited by nature; flower petals, seashells, and even hurricanes and human faces exhibit a Fibonacci pattern in one way or another. But, in that markets are ultimately just a reflection of human-driven patterns and human psychology, many traders have found success in applying the principles of Fibonacci numbers by applying them to stock or index charts.
Fibonacci lines are named after their discoverer... an Italian mathematician who, before dying in the 1200's, recognized a unique mathematical principle frequently observed in nature. That principle/pattern is simply that, in a string of numbers that begins with 0 and then proceeds to 1 and is then extended by adding the prior two numbers together will always yield the same proportional increase of the previous number. That proportion is 1.618 greater than any previous number.
Clear as mud? An example will clarify the idea.
In the string of numbers below, each number in the series is the sum of the prior two numbers:
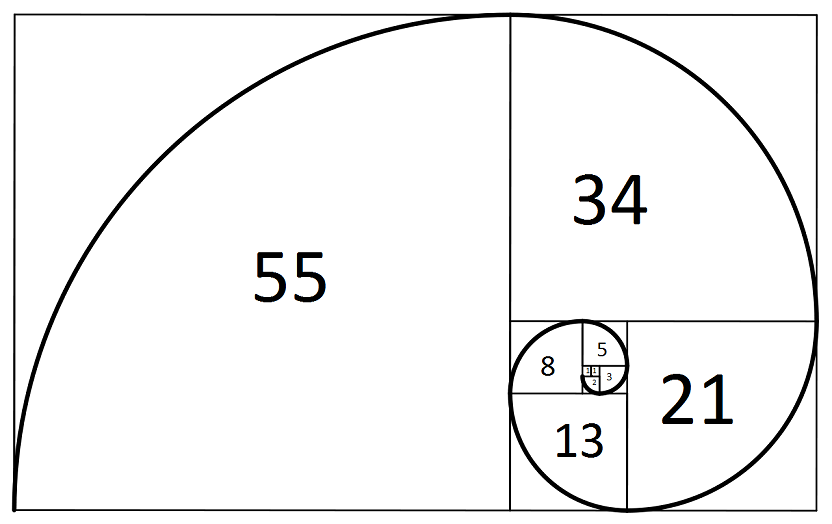
0, 1, 1, 2, 3, 5, 8, 13, 21, 34, 55, 89, 144, 233, 377...
That is, 0 + 1 = 1, 1 + 1 = 2, 1 + 2 = 3, 3 + 2 = 5, 5 + 3 = 8, 8 + 5 = 13, 13 + 8 = 21, 21 + 13 = 34, and so on.
The so-called "golden number" - the Fibonacci number is - 0.618, because each number divided by the prior number equals 1.618 (when rounded), while each number divided by the number one place ahead of it in the sequence equals 0.618. For example, 89/144 = 0.618, 144/89 = 1.618, 13/21 = 0.618, and 21/13 = 1.618.
These numbers and their consistent proportions are evident in many facets of nature. As an example, the shape of many seashells as well as the size/length of a spiraling hurricane following a Fibonacci sequence, and many flowers only grow a number of petals that are a Fibonacci number.
The distance of the eyes and the mouth of the human face are also placed with respect to Fibonacci numbers. That is, the eyes are placed at 0.618 of the distance between the bottom of the chin and the top of the head, while lips are placed 0.618 of the distance from the top of the head to the bottom of the chin.
Mathematically, we could also say the mouth is placed 0.382 (1.0 - 0.618) of the distance from the bottom of the chin to the top of the heard, and that the eyes are 0.382 (1.0 - 0.618) of the distance from the top of the head to the chin.
This number and its corollary -- 0.618 and 0.382 -- can also be applied to charts, with the expectation that a nature-driven market is prone to making retracements that are either 0.618 or 0.382 of distances traveled by a stock or index.
An example will illustrate. On our chart of Level 3 Communications (LLL) below, the 2011-through-2014 rally from a low of $58 to a high of $127 was met by a near-perfect 38.2% retracement of that entire $69 span once it finally cooled off in mid-2014. All it took was a brush of that support line, though to rekindle a rally that ended up carrying LLL above $127 on the second effort.
LLL Weekly Fibonacci Retracement Chart
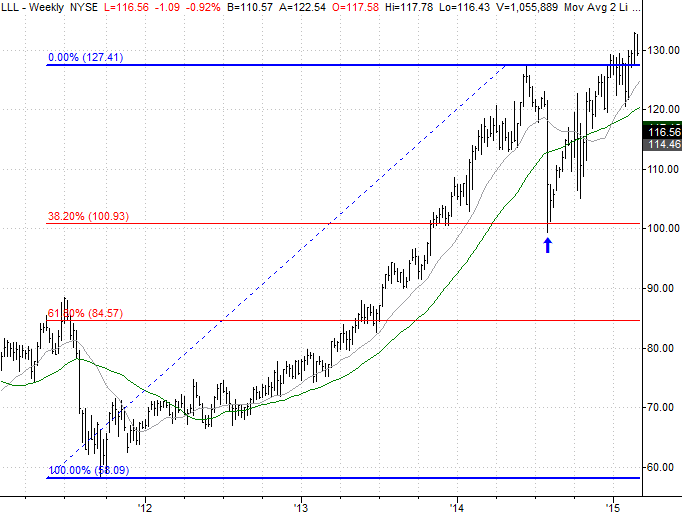
The 61.8% retracement could have been just as meaningful as the pullback to 31.8% of that 69-point span.
Fibonacci lines don't always hold up as support, however, but even when they don't they can be just as telling. Once they're breached as support and resistance, that's often a sign that the bulls or bears have developed a great deal of momentum.
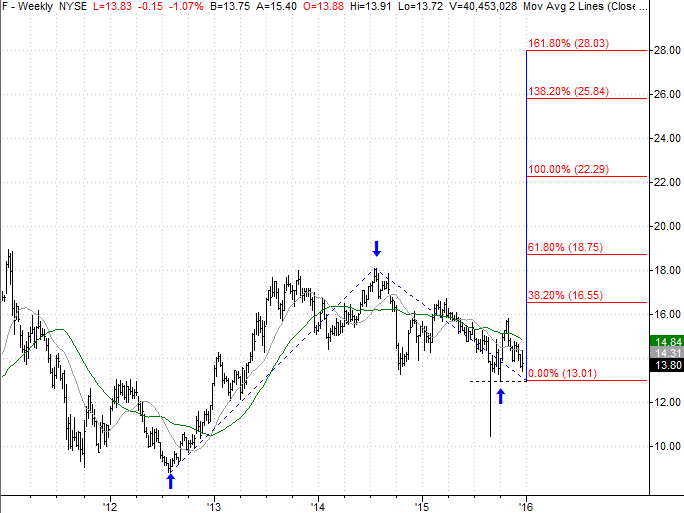
Fibonacci lines don't just mark potential retracement levels, however. Fibonacci extension or expansion lines also offer meaningful upside or downside targets. In our example with Ford (F) below, there are several potential Fibonacci-based target all based on the rally from the 2012 low to the 2014 high back to the 2015 low (excluding the one odd-ball 2015 low briefly seen in 2015). Any of those extensions - all some variation of the golden number of 0.618 - could make for important price targets.
F Weekly Fibonacci Extension Channel Chart
As is the case with any other trading tool, Fibonacci lines aren't fool-proof. They do provide meaningful downside and upside targets when no other technical context offers such targets, though, and for that reason can provide value to traders.
Like all other technical analysis tools, practicing with them and simply using them for hypothetical trading purposes allows a trader to understand their nuances and how they've best applied (or if they're better off not applied, depending on the circumstances).