Gold Prices May Be Poised for Near-Term Bounce, But Long-Term Trend Remains Grim
For the first time in a long time, gold prices (GLD) aren't getting kicked around with oil prices (USO). It's not an entirely surprising premise; the underlying dynamic and fundamentals of the two commodities are plenty different. But, for the bulk of 2015, traders have kept oil and gold in the same basic bearish boat. The fact that gold futures aren't breaking down now not only says the two are now disconnected, but the shape of the gold futures chart suggests the metal may be working on a near-term recovery.
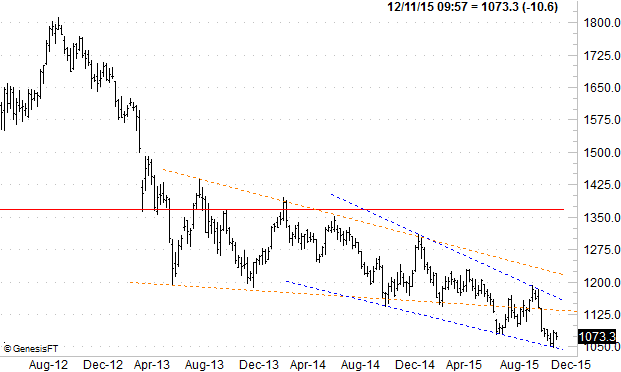
The charts below tell the story. A bearish wedge pattern (orange, dashed) that was gradually driving gold prices lower in 2013 and 2014 broke down this year, setting up a new bearish wedge pattern (blue, dashed) with a sharper downward slope. Three weeks ago gold prices found the lower edge of this new converging wedge pattern, and like clockwork, the selling stopped.
Gold Weekly Chart
Zooming into a daily chart of gold futures, we can get a little more detail on the brush of a key support line and the subsequent off of it. Given the pattern in play, though it won't likely move in a straight line, odds are good gold prices will rally back to the upper edge of the current wedge pattern... currently near $1160 (though falling fast).
Gold Daily Chart
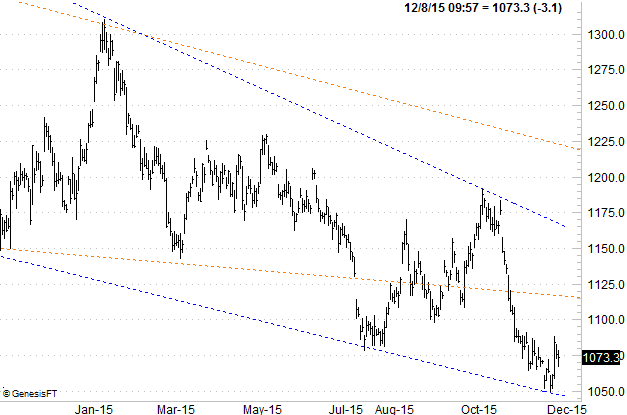
Once the upper boundary of the wedge pattern is met, only time will tell the outcome. The pattern says it's apt to end bullishly, however.