S&P 500 Q4 Cash Balance Remains Near 10-Year High
Seven out of Nine Sectors Reduce Cash Balances in Q4
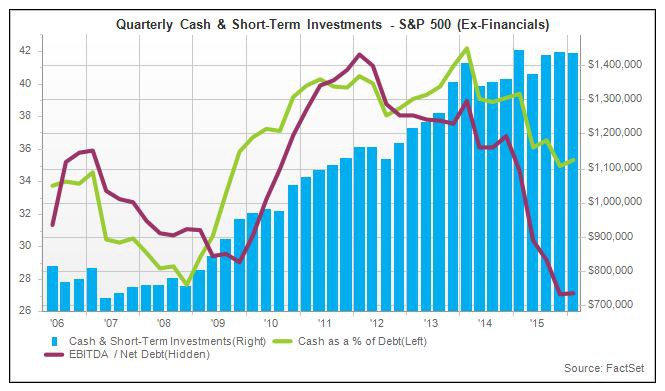
The S&P 500 (ex-Financials) (SPX) (SPY) cash and short-term investments balance (“cash”) amounted to $1.44 trillion in the fourth quarter, which marked a 0.5% decline from the year-ago quarter and was essentially flat with the third quarter. The cash total in Q4 represented the third highest amount in 10 years. The only two quarters in which the index had a higher cash balance were Q4 2014 and Q3 2015.
The Information Technology sector (XLK) had the largest cash balance ($580.2 billion) at the end of Q4, which has been the norm over the past 10 years. The sector saw its balance grow 15.1% from the year-ago quarter. The Information Technology sector was the only group to grow its cash and short-term investments total in Q4 on a year-over-year basis. Seven out of the nine sectors posted year-over-year downticks in their cash balances (Utilities sector (XLU) was flat with year-ago quarter). This was a stark contrast to Q3, when seven out of the nine sectors posted year-over-year increases in cash. The Energy sector (XLE) saw the largest reduction, with the group logging a 13.4% decline in Q4 on a year-over-year basis.
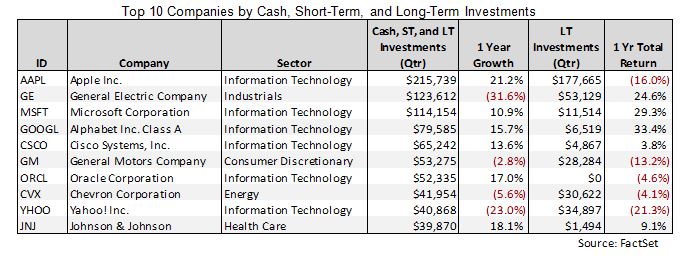
Apple Ends Q4 with $215.7 billion in Cash, Short-Term, and Long-Term Investments
Six of the top 10 companies ranked by quarterly cash and short-term investments were in the Information Technology sector: Microsoft (MSFT) ($102.6 billion), Alphabet (GOOGL) ($73.1 billion), Cisco Systems (CSCO) ($60.4 billion), Oracle (ORCL) ($52.3 billion), Apple (AAPL) ($38 billion), and Intel (INTC) ($25.3 billion). Keep in mind that these cash totals do not include investments with maturities longer than a year. Looking at the Q4 balance of cash, short-term investments, and long-term investments (“total cash”), Apple and General Electric (GE) topped the list. Apple ended the fourth quarter with total cash of $215.7 billion, with long-term investments making up 82% of the iPhone maker’s total cash balance. General Electric logged a total cash balance of $123.6 billion, with long-term investments making up 43% of its total cash amount.
Despite 41% Reduction in Energy CapEx, Spending Levels Still Close to Index Highs
Fixed capital expenditures for the S&P 500 (Ex-Financials) index totaled $170.4 billion in Q4, which represented a 9.8% decrease from the year-ago period. Despite the decline, Q4 still marked the third largest quarterly CapEx total in the past 10 years, with Q4 2014 and Q4 2013 being the only periods to post higher totals. The record level of CapEx for the index in the year-ago quarter led to the year-over-year decline in Q4. On a quarter-over-quarter basis, fixed capital expenditures for the S&P 500 (Ex-Financials) increased 8.4%.
At the sector level, six out of nine sectors saw growth in fixed capital expenditures in Q4 (Consumer Discretionary (XLY), Health Care (XLV), Industrials (XLI), Information Technology, Telecom, (XTL) Utilities). The Telecom sector led year-over-year growth, posting a 19.4% increase in CapEx. The increase was primarily led by AT&T and Verizon, as each ended Q4 with over $5 billion in CapEx. The Utilities sector saw the second highest year-over-year growth rate in fixed capital expenditures (9.5%). Growth in this sector was much more widespread as companies like Southern Company (SO), Xcel Energy (XEL), Duke Energy (DUK), and WEC Energy (WEC) each increased their CapEx by over $250 million in Q4 compared to the year-ago period.
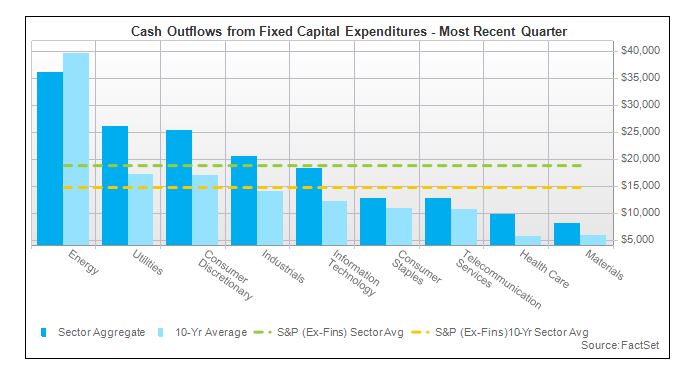
The biggest movement in Q4 fixed capital expenditures came from the Energy group. Similar to the last few quarters, Energy companies made large cuts to CapEx, as macroeconomic headwinds continued to weigh down the sector. Fixed capital expenditures in the sector declined 41.2% in Q4 on a year-over-year basis and stood 8.9% below the 10-year average amount. By the end of Q4, aggregate CapEx in the Energy sector made up only 21% of the total for the S&P 500 (Ex-Financials) index. Back in Q4 2014, the Energy sector made up nearly 33% of the total fixed capital expenditures for the index. On a trailing twelve-month basis, CapEx in the sector dropped 31.3% compared to the trailing twelve months period ending in Q4 2014. Looking at the top 10 list of companies ranked by largest year-over-year cuts to quarterly fixed capital expenditures, seven out of the top 10 are in the Energy Sector (XLE). Southwestern Energy (SWN), Exxon Mobil (XOM), ConocoPhillips (COP), and Chevron (CVX) each cut spending by over $2 billion compared to the year-ago quarter.
Aggregate Ex-Energy CapEx Increases 5.3% Year-Over-Year
Excluding the Energy sector, Q4 aggregate fixed CapEx for the S&P 500 (Ex-Financials) index increased 5.3% year-over-year. Going back historically, the Ex-Energy (and Ex-Financials) index has not posted a year-over-year decline in quarterly fixed capital expenditures since Q1 2010. This just highlights the significance that the Energy sector plays in the index in terms of capital spending.
Companies in the S&P 500 (ex-Financials) generated $386.3 billion in operating cash flow (OCF) in Q4, which represented a year-over-year decline of 2.3%. The decline was a bit misleading given the high water mark set in Q4 2014, which was the largest OCF total in10 years ($395.5 billion). On a sequential basis, Q4 operating cash flow grew 8.2%. The fourth quarter marked the second largest operating cash flow amount for the index in 10 years. After subtracting fixed capital expenditures, aggregate free cash flow amounted to $215.9 billion, which reflected a 4.5% increase year-over-year and a 7.3% increase quarter-over-quarter. The Q4 free cash flow total was the largest quarterly amount in 10 years. Free cash flow grew year-over-year in four out of the nine sectors in Q4 (Telecom, Health Care, Consumer Staples (XLP), and Energy).
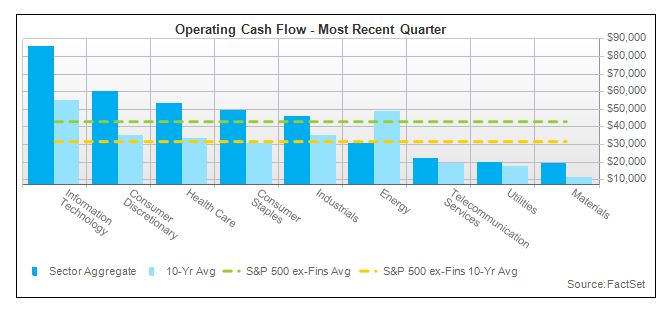
At the sector level, four of the nine sectors showed year-over-year increases in operating cash flow (Telecom, Health Care, Consumer Staples, and Utilities). The Telecom and Health Care sectors led year-over-year growth, posting increases in OCF of 40% and 29.1%, respectively. AT&T (T) and Verizon (VZ) were the top contributors in the Telecom sector, as each company added over $3 billion to its quarterly operating cash flow in Q4 compared to the year-ago quarter. Merck (MRK), AbbVie (ABBV), and Gilead Sciences (GILD) were the biggest contributors in the Health Care sector.
Operating Cash Flow in Energy Sector Falls for Sixth Consecutive Quarter
On the other end of the spectrum, the Energy sector saw aggregate operating cash flow drop 40% year-over-year in Q4. This was the sixth consecutive year-over-year decline in operating cash flow. Companies in the Energy sector struggled to generate revenue once again in Q4, as oil prices slid 27.8% during the quarter (10/31/2015-1/31/2016). As a whole, the Energy sector only generated $199.9 billion in aggregate revenue during Q4, which was the lowest amount in 10 years. With that said, the price of crude has rallied year-to-date (+8.5%) as markets anticipate a production freeze by some of the major oil producers.
With operating cash flow for Energy companies declining, it is interesting to look at these companies’ cash flow to debt ratios. This ratio provides an indication of a firm’s ability to cover its debt with its trailing twelve month operating cash flow. The average cash flow to debt ratio for Energy companies during the trailing twelve months ending in Q4 was 0.41. Anadarko Petroleum (APC) was the only firm to post a negative ratio. The companies in the Energy sector with the lowest cash flow to debt ratios were: Williams Companies (WMB) (0.11), Chesapeake Energy (CHK) (0.11), ONEOK (OKE) (0.12), Kinder Morgan (KMI) (0.13), and Spectra Energy (SE) (0.18).
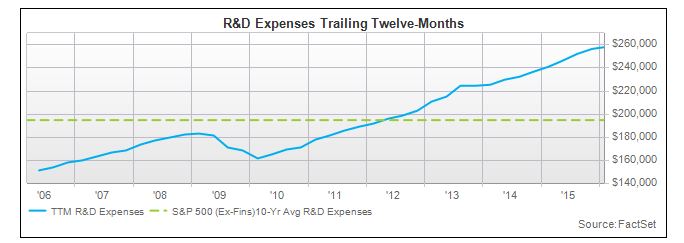
Research and Development Spending Hits Record High for Ninth Consecutive Quarter
Spending on research and development has been a strong spot for the S&P 500 (Ex-Financials) index recently. The amount of capital spent on R&D expenses amounted to $258.6 billion over the trailing twelve months ending in Q4. This represented another 10-year high for the index and marked the ninth consecutive quarter that aggregate R&D spending hit a 10-year high. The Information Technology ($114.1) and Healthcare ($67.7) sectors led all other groups in terms of R&D spending, with nine out of the top 10 companies ranked by R&D expenses coming from these two sectors. Alphabet ($12.3 billion) and Intel ($12 billion) were the top spenders on R&D in the Information Technology sector, while Johnson & Johnson (JNJ) ($9 billion) and Pfizer (PFE) ($7.7 billion) were the top spenders in the Health Care sector. Amazon (AMZN) increased its research and development spending by 25% in the trailing twelve months ending in Q4, making it the number two spender in the index behind Alphabet.
Investing Activities: Asset Acquisitions Increase year-over-year; GE Drives Uptick in Business Divestitures
The amount of cash spent on assets acquired from acquisitions was $71.3 billion in Q4, which marked a 23.2% increase from the year-ago quarter, but well below the $126.5 billion spent in Q3. The spending in Q4 was concentrated in the Industrials ($20.8 billion), Consumer Discretionary ($17.1 billion), and Health Care ($16.6 billion) sectors. Spending on assets acquired from acquisitions in these three sectors made up 76% of the total spending in the S&P 500 (ex-Financials). Some of the big spenders in these sectors were: General Electric, Dollar Tree (DLTR), Honeywell (HON), St. Jude Medical (STJ), and AmerisourceBergen (ABC).
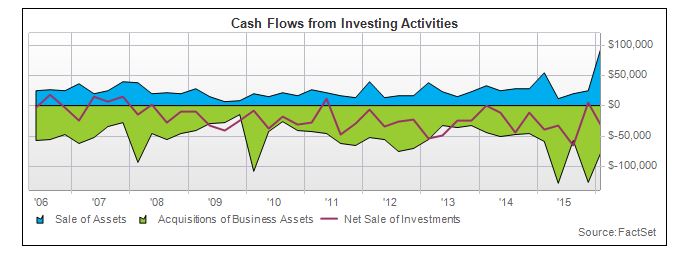
Looking at other investing activities, companies in the S&P 500 (ex-Financials) saw cash flows from the sale of business assets soar to $103.3 billion, the index’s highest quarterly amount in 10 years. The Q4 total of business divestitures was nearly double the second highest total which occurred in Q4 2014. Sale of business assets was driven by General Electric, who began selling off assets associated with its financial services unit, GE Capital. Business divestitures amounted to $81 billion in Q4 for the company. The index saw cash outflows from the net purchase of investment securities of $36.2 billion in Q4, while the 10-year average was $19.5 billion in cash outflows.
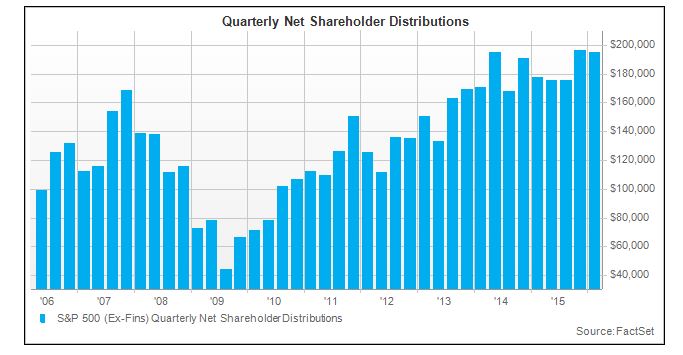
Quarterly Net Shareholder Distributions Increase 10% Year-Over-Year
Quarterly net shareholder distributions, which are calculated by adding dividend payments and net purchases of stock, amounted to $195 billion in Q4. This represented a 10% increase year-over-year and a 0.7% decrease quarter-over-quarter. The fourth quarter total was the third largest amount of net shareholder distributions for the S&P 500 (ex-Financials) in at least 10 years. Further details on dividends and share buybacks in the S&P 500 can be found in the FactSet Dividend Quarterly and FactSet Buyback Quarterly reports. At the company level, Apple, United Technologies (UTX), and Microsoft were the top firms ranked by quarterly net shareholder distributions.
Cash Flows from Net Debt Issuance Amount to $101.2 billion in Q4
On the debt financing side, cash inflows from net debt issuance amounted to $101.2 billion at the end of Q4. This was a 6.2% increase from Q3, but a 1.8% decrease from the year-ago quarter. The main contributor to the quarter-over-quarter increase in cash inflows from debt issuance was Visa (V). In Q4, Visa issued $15.9 billion worth of bonds to finance its $23.1 billion acquisition of Visa Europe Ltd.
Courtesy of factset.com