‘Stagflation’ could be the latest 1970s trend to make a comeback
It’s a ‘tail risk’ worth hedging against: Bank of America Merrill Lynch
First it was bell-bottoms, turtlenecks and psychedelic prints. But now another less-beloved trend from the 1970s might be on the verge of a comeback.
In a note to clients released Thursday, a team of analysts at Bank of America warned that investors should at least prepare their portfolios for the possibility of stagflation—an economic phenomenon in which slow growth, relatively high unemployment and inflation occur contemporaneously.
Stagflation was a major problem for the U.S. during the 1970s, when the OPEC oil (USO) embargo helped fuel an inflationary spiral while also crimping economic growth. Inflation as measured by the consumer-price index peaked at an average annual rate of 13.5% in 1980 before the Federal Reserve, led by former chairman Paul Volcker, finally put a stop to it by cranking up interest rates.
“While it is not our base case, investors may want to hedge the tail risk of the economy experiencing elements of stagflation realized as rising inflation during stagnating growth,” said Bank of America’s global rates and currencies research team in the note.
Some might find the prospect of higher inflation confusing. It wasn’t long ago that market strategists were warning about the prospect of deflation in the U.S. as the dollar strengthened and commodity prices dropped.
That now appears unlikely. In a note to clients published Thursday, Deutsche Bank’s Rineesh Bansal dismissed these concerns as “puzzling,” and pointed out that core inflation across G-7 countries rose to 1.5% at the end of 2015—its highest level in three years. While the average rate of headline inflation in the developing world was above 5% in 2015.
Bank of America’s strategists aren’t the only ones talking about this. In a column published earlier Thursday, The Wall Street Journal’s James Mackintosh said that the widening 10-year inflation “break-even” (the spread between the benchmark 10-year yield and its inflation-protected counterpart) suggests investors are already bracing for stagflation’s return.
It has been a long time since the U.S. economy experienced stagflation—which Bank of America defines narrowly as any period when growth breaks below the 25th percentile of its historical average while inflation trends above its 75th percentile.
(When making these determinations, BoA uses growth data dating back to 1960, but only factors in PCE core inflation dating back to 1990. It does this to eliminate the exorbitantly high inflation from the 70s and 80s from calculations of the historical average.)
For stagflation to recur, according to Bank of America’s standards, GDP growth would need to slip below 1.4% while the quarterly growth rate for core PCE rises above 2.3%. (Bank of America calculates quarterly changes in core PCE at an annualized rate).
That’s not such an outlandish idea: growth during the fourth quarter of 2015 was just 1%, according to the most recent reading. A third reading on fourth quarter growth is expected to be released on Friday.
Meanwhile, core inflation nearly doubled in the 12 months leading up to January, according to the PCE.
Bank of America’s big data leading indicator suggests this might already be happening. It’s forecasting below-trend growth for both the first and second quarters. The indicator is compiled “from a large panel of economic and financial variables,” the analysts said.
Stagflation won’t be familiar to many investors. The economy briefly met BofA Merrill’s stagflation definition during the first quarter of 2008 as growth fell off a cliff but inflation held steady. But it only lasted for a quarter.
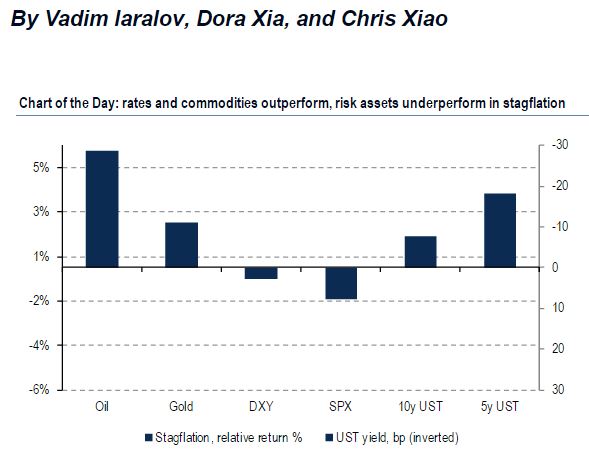
So how should investors prepare for this eventuality? According to Bank of America’s historical analysis of market trends, gold (GLD), oil (USO) and U.S. Treasurys (TLT) tend to outperform during periods of stagflation, while equities (SPY) (IWM) (DIA) (QQQ) tend to underperform.
The U.S. dollar (UUP) also tends to weaken, but the impact is more muted.
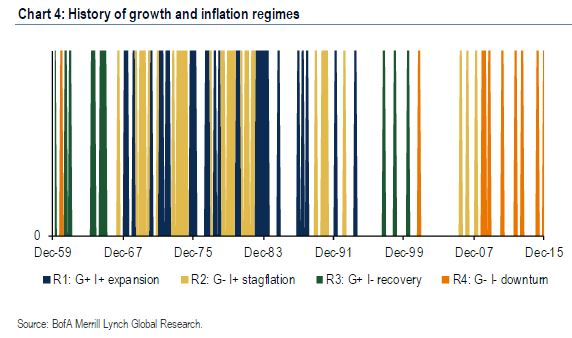
To arrive at this conclusion, Bank of America divided historical market data into four “regimes”—downturn, recovery, stagflation, and expansion—and then compared asset performance during those periods to historical trends.
So equity bulls beware: If first quarter GDP disappoints, as Bank of America expects, one might want to consider buying gold or Treasurys as a hedge.
Courtesy of marketwatch.com