Mid-Year Performance Analysis Of The Broad Market & Key ETF Sectors
Mid-Year Performance Analysis Of The Broad Market & Key ETF Sectors
Historical 1st Half vs. 2nd Half Performance
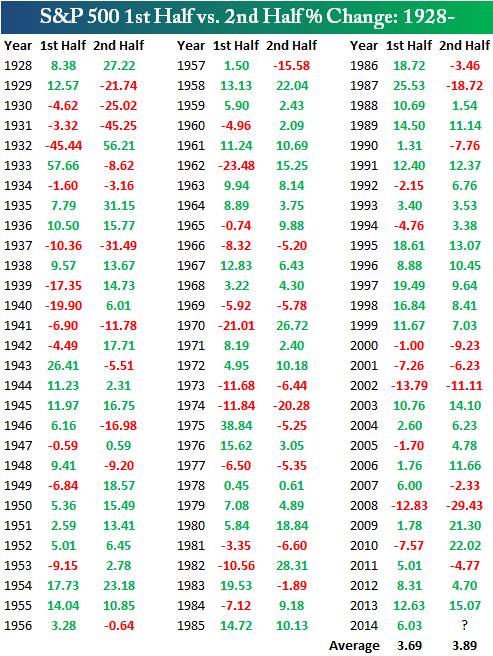
We've reached the mid-point of 2014. One of the simplest data points is the market's performance in the first and second half of the year. Below is a table highlighting the S&P 500's (SPX) (SPY) first vs. second half performance going back to 1928. As shown, the index has averaged a first half gain of 3.69% throughout its history, while it has averaged a second half gain of 3.89%. This year marked the fourth consecutive year with a first half gain of more than 5%. Throughout this bull market going back to 2009, we've only seen the index fall in the second half in one year -- 2011. Every other year has seen pretty nice second half gains.
Historical S&P 500 Performance Chart By Year Half

ETF Sectors Mid-Year Performance
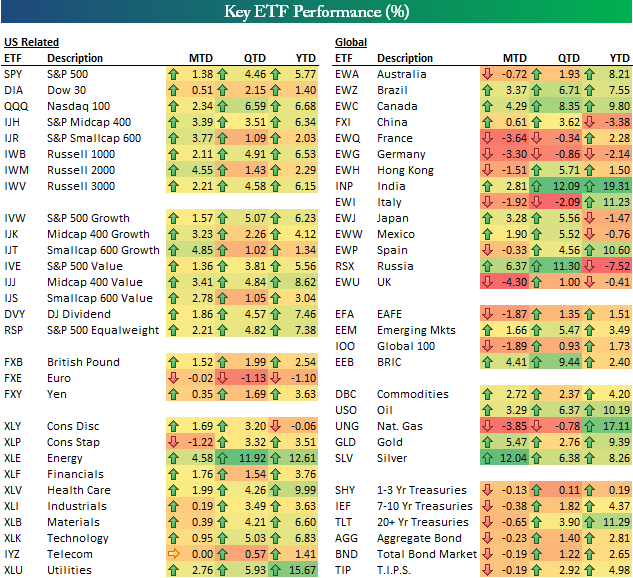
Below is a look at the month-to-date, quarter-to-date and year-to-date performance of various asset classes using key ETFs. A couple of months of nice gains for US stocks has left the bulk of ETFs on the left side of the matrix up nicely year-to-date. The gains might not be what they were last year, but most investors would have signed up for a first half gain of 5.77% for the SPY at the start of the year. A notable laggard in terms of year-to-date performance is the smallcap sector (IJR, IWM, IJT, IJS), while big winners in US markets in the first half have been midcap value (IJJ), dividends (DVY), Energy (XLE), Health Care (XLV), and Utilities (XLU).
Globally, India (INP) has seen the best gains at nearly 20% year-to-date. Italy (EWI) and Spain (EWP) may both be out of the World Cup, but their markets are up more than 10%. Canada (EWC) has also seen solid gains in the first half with a gain of 9.80%. On the downside, China (FXI), Germany (EWG) and Russia (RSX) have seen the biggest losses year-to-date, while Japan (EWJ), Mexico (EWW) and the UK (EWU) are all down slightly.
Commodity ETFs are up across the board year-to-date now that gold (GLD) and silver (SLV) have rallied recently. Fixed income ETFs are up across the board too, although they have fallen a bit in June.
ETF Sector Mid-Year Performance Chart

Courtesy of bespokeinvest.com
