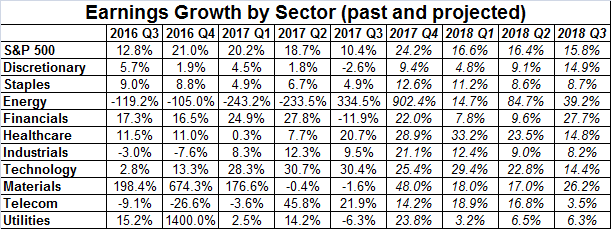
It's officially underway. In fact, it's 20% done. Third quarter earnings season that is. In fact, 21.5% of the S&P 500's constituents have reported their Q3 results. Though we've seen more beats than misses, the overall earnings outlook for the third quarter is already on pace to roll in lower than anticipated just at the end of September.
It's still early in the ball game to be drawing conclusions. Several key companies -- and several important technology companies in particular -- have yet to share last quarter's numbers, so the numbers as they stand right now could change dramatically between now and then. There's no denying the market is broadly on the defensive though, even as stocks push their way to record highs.
The scenario presents something of a dilemma. That is, stocks were already overvalued, but they're uncomfortably overvalued right now. Investors have made huge bullish bets on future earnings growth, with most presuming Donald Trump's pro-growth agenda (and his tax reform plan in particular) will get traction. If they don't, or if they only partially do, the market's extreme valuation right now could turn into a liability in a hurry, up-ending the market.
The numbers: As of October 19th, the S&P 500 is projected to have earned $31.66 per share for the third quarter of 2017. That's down from the outlook of $32.90 the pros were modeling just three weeks ago. Not surprisingly, these analysts are also dialing back their Q4 and 2018 earnings outlooks.
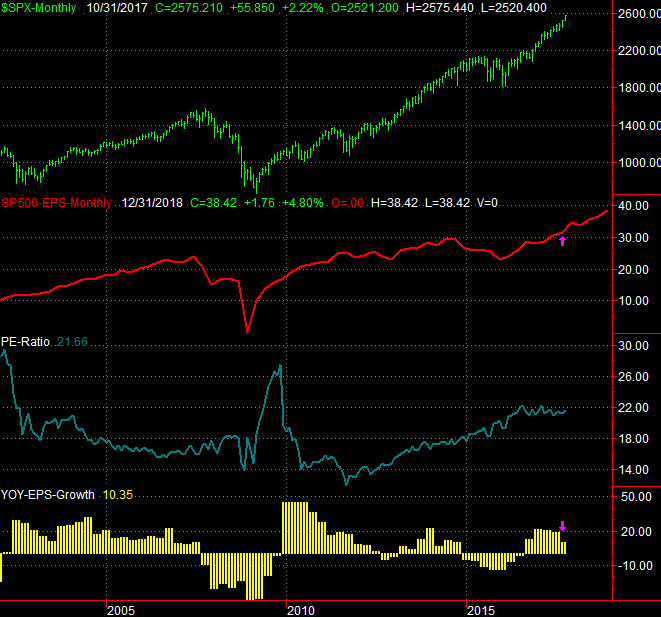
The end result? The S&P 500 is now trading at a trailing P/E of 21.7, and a forward-looking P/E of 18.4. Both are well above historical norms, even in a low-rate environment that tends to prompt relatively frothy valuations. Of course, rates aren't exactly low anymore, and they're only going to get higher over the course of the coming 24 months.
Interestingly, the S&P 500 has been valued at P/E ratios slightly above -- though not dramatically above -- the current P/E of 21.7. It's been holding at that valuation since the middle of 2016. Perhaps we're at that valuation cap right now, though bear in mind that earnings are still growing, setting the stage for more stock gains. The third quarter's earnings of $31.66 are 10.3% better than Q3-2016's bottom line, and analysts foresee earnings growth along those lines through the end of 2018.
Either way, on the above chart we can see how far the market has come since late-2015. The S&P 500 has gained nearly 30% since the end of 2015, in step with the earnings turnaround.
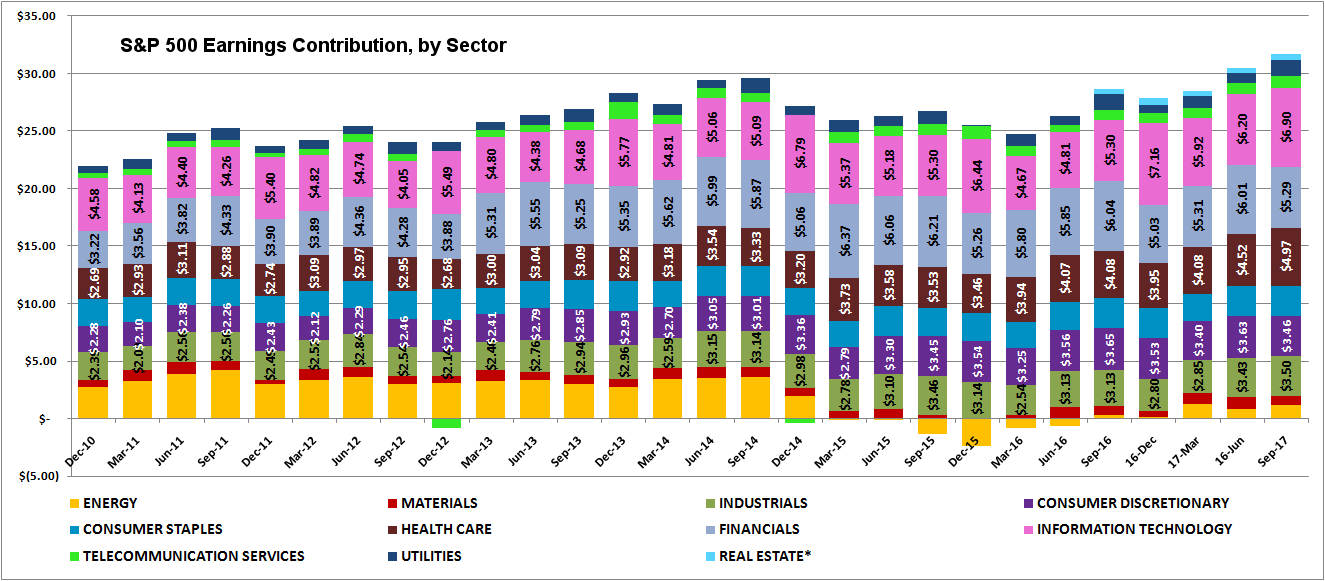
The crux of the marketwide earnings growth, by the way, is mostly attributable to the turnaround from the energy sector. Though these names are so far barely profitable for Q3, they were deep in the red for the third quarter of 2016. For perspective, the S&P 500 Energy Sector Index only earned 87 cents per share n the third quarter of 2016, but is likely to earn $3.78 per share for Q3 of 2017. That's still miles away from the $10 per share it was earning in 2013 before the crude oil meltdown. But, it's still a marked improvement.
The energy sector normally accounts for about 10% of the market's sales and profits, so the big improvement there is making a healthy positive impact on the broad market now. Without the energy sectors relative success, the market's overall earnings for the third quarter wouldn't feel nearly as impressive.
The graphic below tells the tale (presuming you're not color blind).The energy sector's contribution to the S&P 500 quarterly earnings going all the way back to late 2010. Energy's earnings used to be a big deal. It's not anymore. It's becoming a somewhat big deal again though. A closer inspection of this graphic, however, also reveals that only healthcare and technology stocks are really doing all that well... and healthcare's bullish outlook may not be a realistic outlook, given its tepid history. Oddly enough, telecom -- which hasn't been a great performer of late -- has so far been impressive in terms of growth. Industrials have also been a bit of a let-down thus far. Conversely, the initial look as the financial sector's year-over-year growth is likely a fluke. It has been and is expected to be a steady growth machine. [Click on the image for a full-screen view.]
As was noted though, we're still very early in the ball game. These metrics and measures could change, and likely will. The chips are starting to fall though.
Stay tuned for updates. Hopefully the broad market will overcome the early hurdles that have been laid out in front of it.


