Using ADX Trend Strength Technical Analysis Chart Indicator

Average Directional Index (ADX)
The average directional index (ADX) indicator measures the strength of a trend, whether that trend is bearish or bullish.
The ADX indicator is often used in conjunction with the Directional Movement Index (DMI) lines. In fact, the ADX line is derived from the relationship of the two DMI lines (+DMI and -DMI), and is plotted on the same scale from 0 to 100.
It's also an indicator that requires close attention, as it would be easy to misinterpret.
Unlike most other oscillators, the average directional index rises when a stock's or index's trend is rising sharply. The ADX line, however, also rises when a stock or index is falling sharply. As was noted, it's merely an indicator of a trend's strength... not an indicator of that trend's direction.
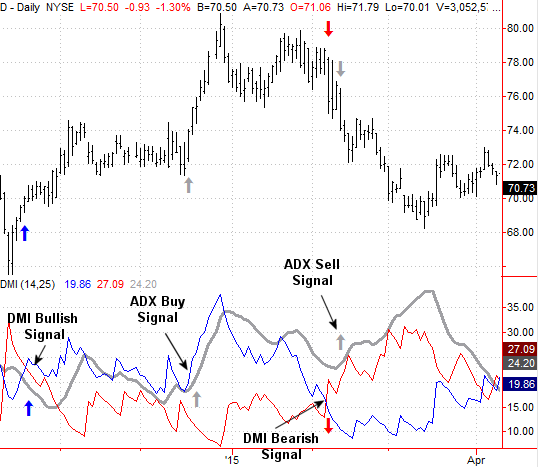
An example will clarify how average directional index indicator works. On the chart below, the ADX line (gray) is plotted on the same scale as the +DMI (blue) and +DMI (red) lines. Although the +DMI line crossed above the -DMI line early in the chart's timeframe, that trend didn't initially propel the stock higher... and the ADX line didn't rise. But, once the stock began to rally and the +DMI and -DMI lines started to widen their divergence, the ADX line started to rise, telling traders that the trend was not only bullish, but also strong.
Later on in the chart's timeframe the trend is reversed. That is, the -DMI line crosses back above the +DMI line, confirming the stock's in a new downtrend. It was only a short time after that cross of the DMI lines that the average directional index line began to rise again, confirming the strength of the stock's downtrend.
While the ADX indicator is a worthy confirmation tool, it doesn't make for a particularly good trading "trigger" by itself due to its inherent (and sometimes misleading) volatility.
The ADX indicator is formula is....
100 x (moving average of the absolute value of (+DI minus -DI))/(+DI plus -DI)
