Using Elliott Wave For Longer-Term Trading
Using Elliott Wave to invest in mid caps
By Ramki Ramakrishnan
Many people mistakenly think that using technical analysis is reserved for those who trade the market, i.e., those who get in and out of the market relatively quickly. On the contrary, one could very effectively use the Elliott Wave approach to investing in ETFs, for example, the JPMorgan Mid Cap Investment Trust (UK:JMF) that trades in the London stock exchange. This column illustrates that idea with a few interesting charts.
Let me start with a very brief introduction to Elliott Wave Analysis. According to its creator, Ralph Nelson Elliott, all movements in the stock market that follow a trend unfold in five waves. Three waves within this progression are actually upward pointing in an uptrend, and there are two minor waves that serve as intermediary corrections. Once a five-wave move is finished in one direction, we will get a large-sized move in the opposite direction that will serve to correct the entire prior sequence of five waves.
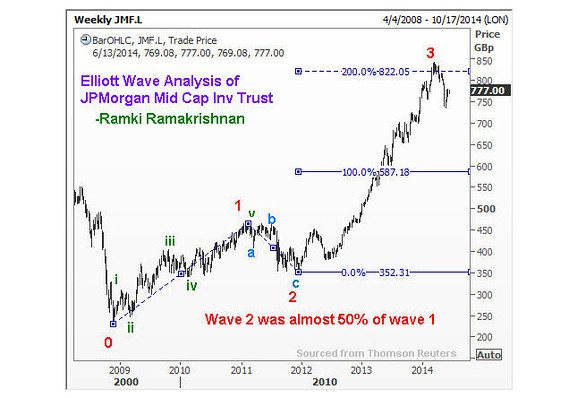
With that admittedly simple introduction in mind, let us look at the JPMorgan Mid Cap Investment Trust ETF in detail. The first chart shows you that we have finished a huge three-wave rally at 842 on March 11, 2014. Observe that wave 3 was just a shade more than 200% of wave 1, and wave 1 itself was made up of five sub waves. Wave 2 corrected wave 1 by almost 50% before we got the extended third wave.
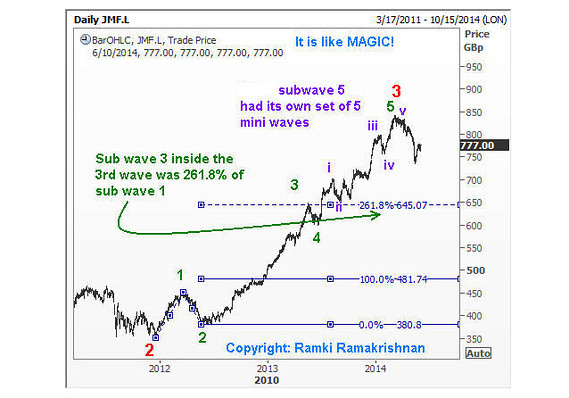
The next chart looks at the third wave in detail. I have made it easy for you to follow the waves by color coding them uniformly on all the charts. As you can see, wave 3 (red) has its own set of 5 sub waves (marked in green). Sub wave 3 traveled a distance of 261.8% of sub wave 1. This is a well-known Fibonacci ratio projection, and Elliott Wave analysts love to see such Fibonacci relationships. Indeed, the extended wave 3 (red) being 200% of wave 1 was also respecting the Fibonacci summation series which goes 1, 2, 3, 5, 8 and so on. Wave 3 was two times wave 1.
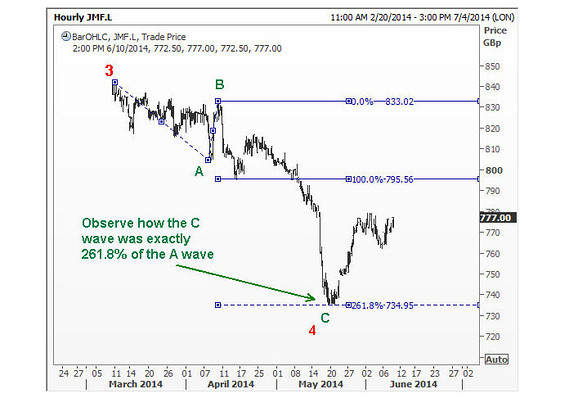
The third chart points out that after completing wave 3, the ETF started coming down as wave 4. Typically, the correction following an extended third wave will come down by 23.6%, and you will see that we came quite close to that level. Have we already posted the low for this ETF, or can we get another push down to the 38.2% level? I have placed a question mark at the point marked as wave 4.
Because we missed that low, as investors, we should wait for additional clues. But first witness the relationship between the sub waves of what could have been wave 4. You can see that the C wave inside wave 4 was related to the A wave by 261.8%. You will be familiar with this Fibonacci ratio by now.
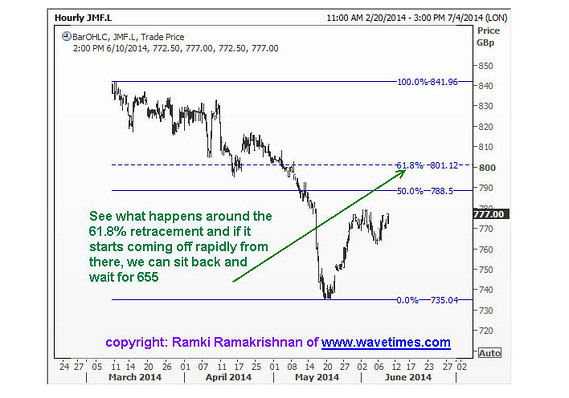
As a next step, I suggest that we keep an eye on the 61.8% retracement of the wave 4 which lies around the 800 level. If the ETF starts coming off from there, maybe we will get a nice move down to around 655, which is the 38.2% retracement level discussed earlier. That will be a terrific place to buy for a nice rally as wave 5.

As investors, we should be alert to key levels where there could be turns that will be great to exploit. As a practitioner of the Elliott Wave approach, I have seen some extraordinary results by waiting patiently for key levels before moving in. You, too, might benefit by incorporating this approach in your strategy. Good luck.
Courtesy of MarketWatch