Using Put/Call Ratios For Contrarian Buy/Sell Signals

Put/Call Ratio: What Is It, and How is It Used?
A put/call ratio is simply a comparison - a ratio - of the number of put options that trade on any given day relative to the number of call options that exchange hands that same.
There are several closely-watched put/call ratios... some that are based on all the options that trade on any given day, some that only compare equity options (meaning that index option trades are excluded), and some that only consider the options traded on stocks that are part of a particular index, like the S&P 500. There are even put/call ratios for individual stocks. All of them, however, are designed to indicate one thing - the market's sentiment regarding a market, a stock, or an index based on the number of bearish put options versus the number of bullish call options traded on any given day.
There's a twist, however, to using a put/call ratio to gauge the market's opinion on an index or stock. That twist is, we - and most traders who track put/call ratios - often view a put/call ratio as a contrarian indicator, meaning we're inclined to be bullish when the put/call ratio is unusually high (suggesting a lot of puts were bought that day), and we're inclined to be bullish when the put/call ratio is unusually low (which suggests traders were mostly buying calls during that trading session).
While all variations of put/call ratios have value, probably the most important one we watch at BigTrends is the equity-only put/call ratio, which explicitly excludes index options. It's just a matter of preference, but we believe so many traders now use index options to hedge, a put/call reading that incorporates index puts and index calls doesn't offer a great deal of insight to contrarians.
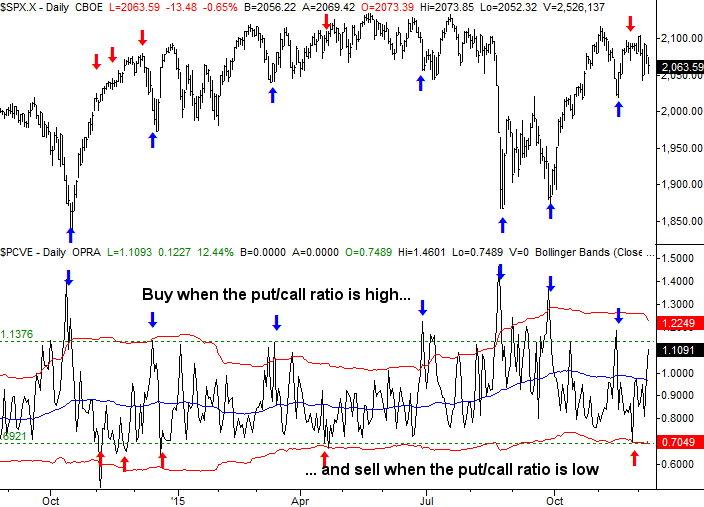
As for how to determine a point where the equity-only put/call ratio is too high or too low and therefore signaling a trend reversal is likely, there is no right or wrong answer. One could use an absolute, static level, or a trader could apply an adaptive tool like Bollinger bands to the put/call reading. On the example chart below, both idea have been applied, and both broadly work as a means of determining when sentiment has become dangerously bullish or unnecessarily bearish; trade-worthy reversals followed in most cases.
SPX Daily Chart with Equity Put/Call Ratio

As is the case with any trading tool, put/call ratios aren't perfect. They can be a powerful tool, though, once their nuances are mastered.
