Weekly Market Outlook – Against the Odds, Stocks Are Ending Q3 On a High Note

Similar to the previous week’s gains, last week’s advance wasn’t exactly a convincing show of bullishness. The S&P 500 only closed about 0.6% higher for the five-day stretch when all was said and done, struggling to hold onto Thursday’s intraday gain.
Progress is still progress though, and beats the alternative no matter how modest it might be. It was enough to carry the index to another record high, sidestepping the weakness we’d normally see in the month of September. We’re entering the last quarter of the year with some clear bullish momentum… although that’s something of a problem in and of itself.
We’ll look at the matter in detail in a moment. Let’s first dissect the economic data reported last week that caused this unlikely bullishness in the first place.
Economic Data Analysis
Last week’s big news, of course, was Friday’s look at last month’s personal income and spending changes… data the Federal Reserve considers when making decisions about interest rates. That wasn’t the only noteworthy news released last week, however. Tuesday’s look at home prices set the stage -- and perhaps set the tone -- for the rest of the week.
Simply put, home prices are still on the rise. The Case-Shiller Index slowed down, while the FHFA Home Price Index accelerated. But, both moved higher (again) in August.
Home Price Index Charts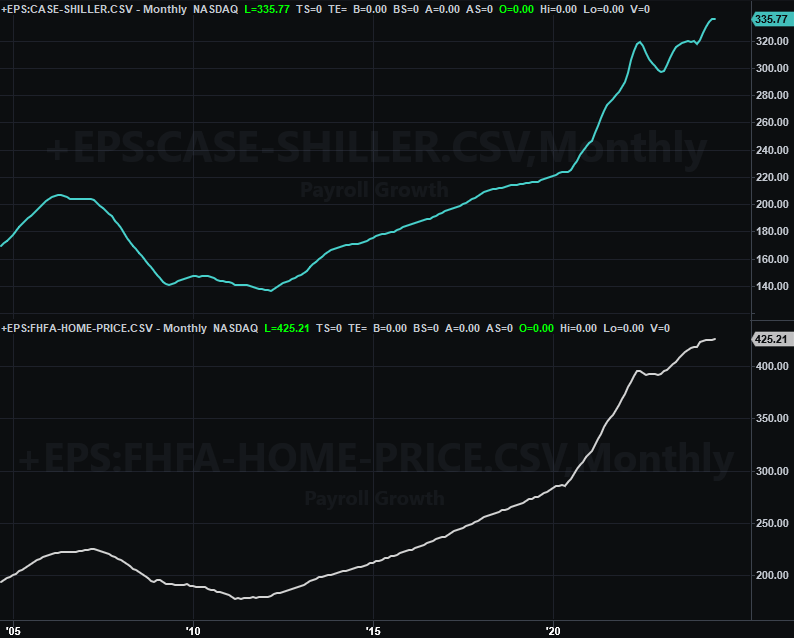
Source: Standard & Poor’s, FHFA, TradeStation
Also bear in mind the recent rate cuts didn’t take shape until this month, so the home price data above doesn’t yet reflect the positive impact on demand that’s already taking shape from that help.
It was also a big week for consumer sentiment numbers, although the data delivered a mixed message. While the chart below shows neither number for September (it only plots the data through August), know that the Conference Board’s consumer confidence score fell to 98.7, while the University of Michigan consumer sentiment score actually inched bit higher to 70.1.
Consumer Sentiment Charts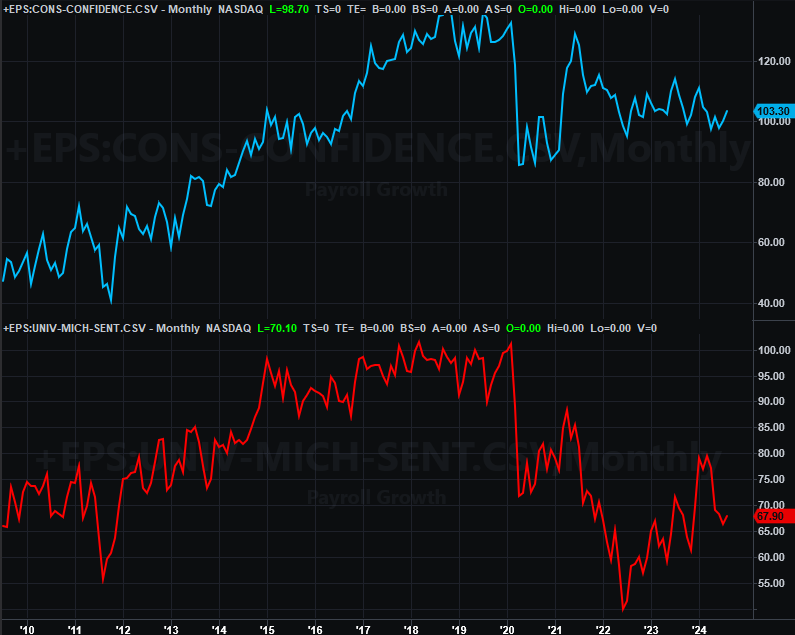
Source: Conference Board, University of Michigan, TradeStation
Neither number is especially impressive before or after September’s data, however. Given this, it’s actually a little surprising the market’s doing as well as it is.
Last month’s new-home sales were posted on Wednesday, rounding out the previous week’s update on sales of existing homes. They did fall as expected, but not as much as expected. Meanwhile, existing home sales are still falling precipitously, with current homeowners still not quite ready to let go of their low-interest mortgages just yet. It’s curious that while home prices remain healthy, there’s not actually a ton of buying and selling going on. Perhaps that will change as well now that financing costs are being curbed. That’s the early indication anyway.
New, Existing Home Sales Charts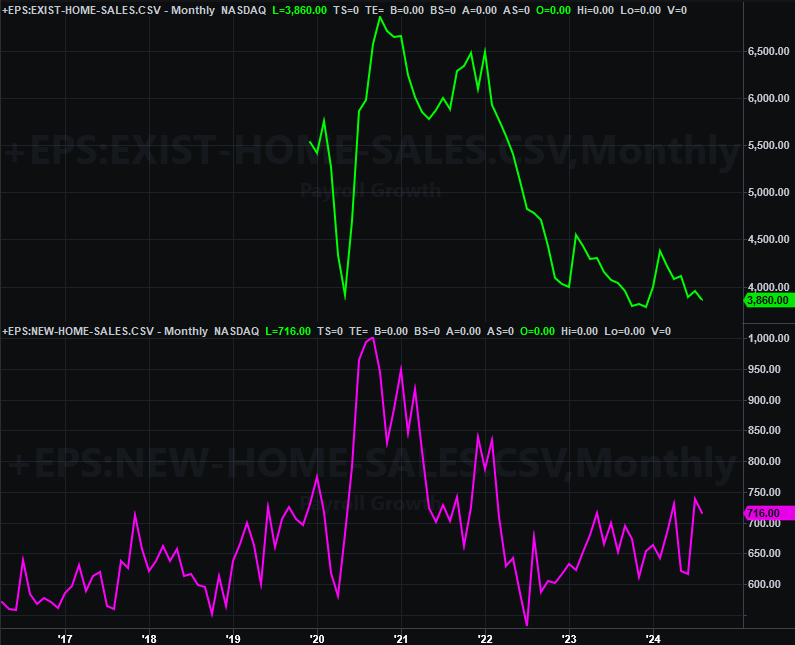
Source: National Assn. of Realtors, Census Bureau, TradeStation
Also on Wednesday we heard the second estimate of Q2’s GDP growth rate, confirming it’s still holding steady at 3.0%. That’s good. Last week’s biggest news though (as was already noted), is August’s personal income and personal spending data. It implies inflation rates continue to edge lower. More to the point, it gives the Fed room and time to move thoughtfully rather than being forced to make a rushed, rattling decision.
Everything else is on the grid.
Economic Calendar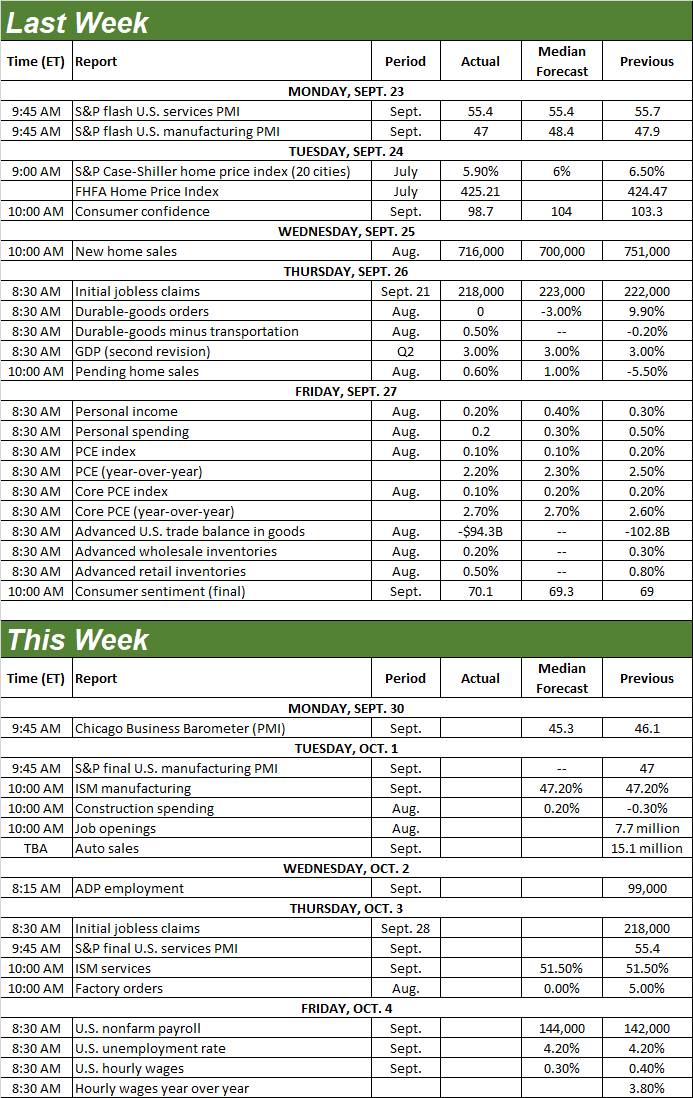
Source: Briefing.com
This week won’t be quite as busy, but there are a couple of data sets to keep your eye on. The Institute of Supply Management’s manufacturing index will be posted on Tuesday, while the services index is coming out on Wednesday. Forecasts suggest both of September’s numbers will be in line with August’s, but neither is particularly compelling as-is.
ISM Services, Manufacturing Index Charts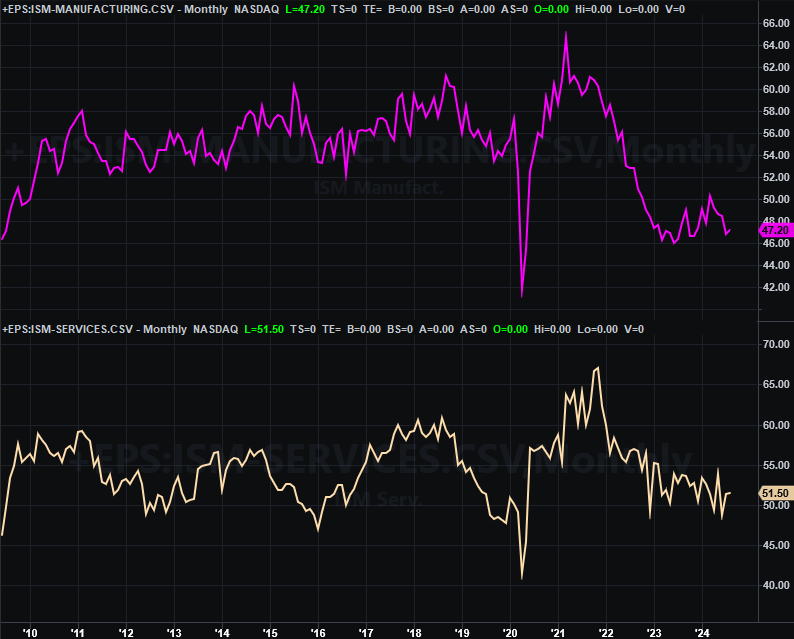
Source: Institute of Supply Management, TradeStation
This week’s big news, of course, will be Friday’s jobs report for September. You may recall that July’s figures started to confirm real cracks, with no real relief arriving in August. Economists don’t think any meaningful help is on the way for September either.
Payroll Growth, Unemployment Rate Charts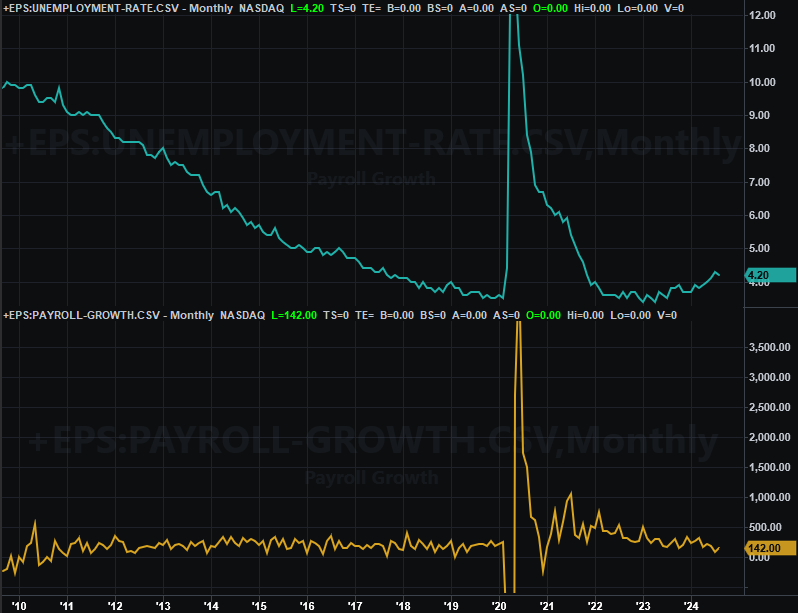
Source: Bureau of Labor Statistics, TradeStation
A poor showing on the employment front could prove problematic for the already-vulnerable market. On that note…
Stock Market Index Analysis
So much for the September swoon. Barring a calamity on Monday, last month was one of the best Septembers we’ve seen in a while, with the S&P 500 on pace to log a monthly gain of just under 1.6%. Even so, given all the bullish news that surfaced just within the past week, traders are still a bit hesitant.
The clue is in the shape of the recent daily bars and -- again -- the lack of volume behind the effort. As the daily chart of the S&P 500 below show us, during the last three days of last week, the index closed BELOW its open. It suggests traders’ tepid bullishness waned as the day wore on. It’s even more odd given that on the last two of those three days, we actually heard good news (solid GDP growth, and tamed inflation).
S&P 500 Daily Chart, with VIX and Volume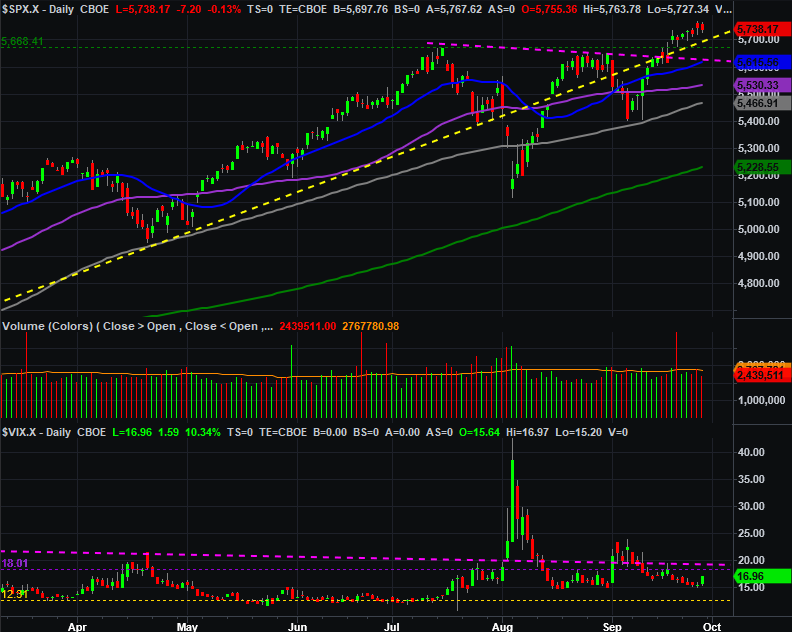
Source: TradeNavigator
The NASDAQ Composite’s daily chart looks similar, having closed below its open on Thursday and Friday. Still, it was able to push all the way past its recent ceiling (white, dashed) at 17,973.
NASDAQ Composite Daily Chart, with VXN and Volume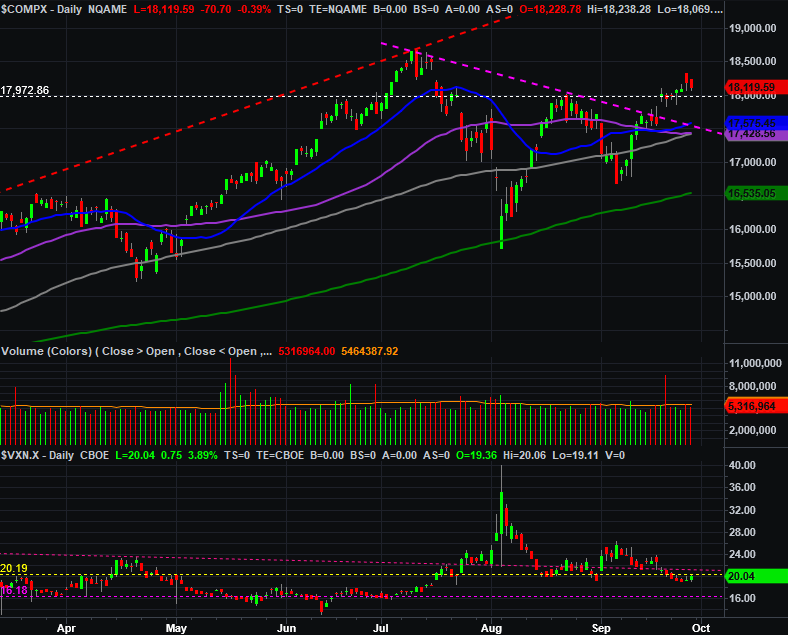
Source: TradeNavigator
On the surface -- and despite the intraday pullbacks and Friday’s slight loss -- this is bullish; the trend is your friend even though this is an odd time of year to see this sort of bullishness. We should interpret things simply and in a straightforward manner. That’s even more so the case when you see the S&P 500’s weekly chart. As it shows us below, the target at 5,656 established by the cup-and-handle pattern that materialized in 2022 and 2023 has been hurdled. We’re (figuratively and literally) in uncharted territory here when we’re not supposed to be.
S&P 500 Weekly Chart, with VIX and MACD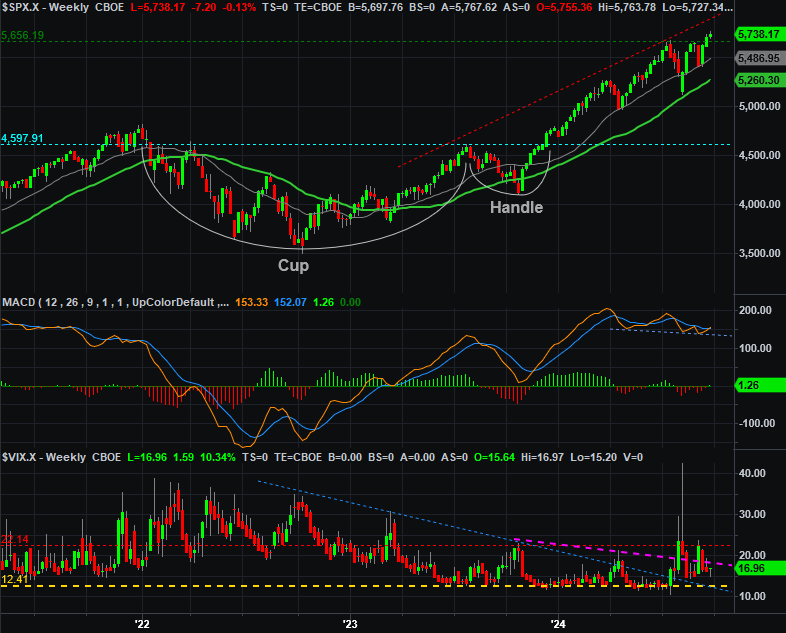
Source: TradeNavigator
Underscoring this this is the fact that the market’s far higher than it would normally be at this point in the calendar year.
Take a look. Even in a good year this isn’t a particularly bullish time of year. This year’s a clear exception… an exception made even more exceptional by the fact that the S&P 500 is now up 21% for the year when it would normally only be up 4.2%, or only 11.5% in a good year.
S&P 500 Annual Cumulative Gain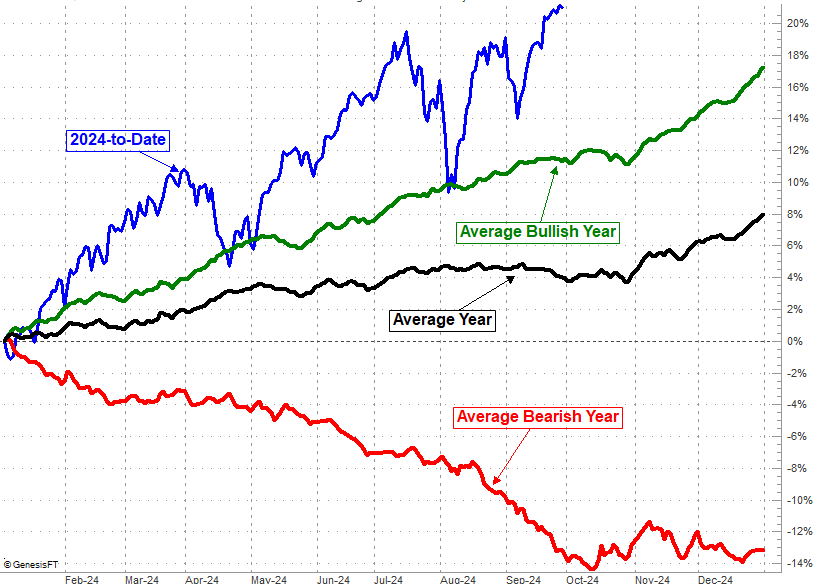
Source: TradeNavigator
So now what? There’s the rub. The undertow is clearly bullish, but arguably shouldn’t be nearly this bullish at this point in time on the calendar. That’s why the rally is balking from time to time now, and balking more often than not. There’s a fear of missing out (or FOMO) on more upside, but traders aren’t completely convinced there’s actually more upside looming here.
Don’t overthink it though. The market’s got a decent track record of defying the odds and doing the unlikely.
Just keep everything on a short leash right now.