Weekly Market Outlook – Another Tough Blow, But Still Not a KO Punch

Stocks may have ended the week on a high note, but consider the circumstances. The market had been shellacked the two days prior. The S&P 500 ended Thursday’s session down 2% for the week thus far. Even with Friday’s 1.1% lift, the index still lost nearly a full percentage point of its value for the five-day stretch.
Perhaps more troubling is the fact that the second weekly loss in a row took a bite out of key technical support levels. Don’t panic just yet though. There’s also still plenty of support that remains intact. We ended last week’s trading very much on the fence.
We’ll pinpoint those floors in a moment below. First, let’s recap last week’s most important economic announcements and preview what’s coming this week.
Economic Data Analysis
Economists were at least hoping for reason for hope on the real estate front last week. They didn’t get it. Rather than improving from May’s miserable new-home sales numbers, they actually edged a little lower from 621,000 to 617,00. And, while forecasts called for a dip from May’s existing-home sales pace of 4.11 million, the reading of 3.89 million was even worse than anticipated. That tumble accelerates the fresh downtrend, in fact.
New, Existing Home Sales Charts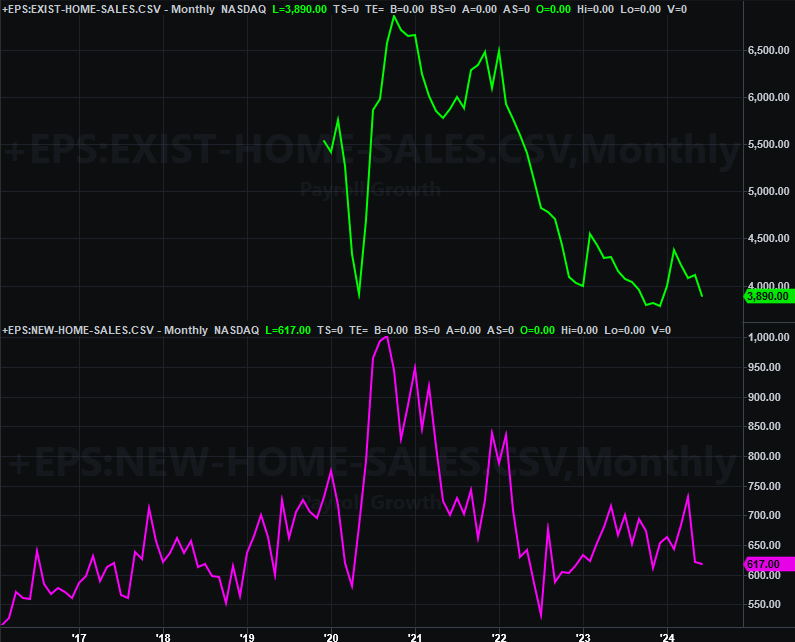
Source: National Assn. of Realtors, Census Bureau, TradeStation
This is noteworthy simply because home prices are reportedly still inching higher. Those prices are based on the average price per sold home. But, it’s only the higher-end homes that are selling, skewing sales prices higher.
It wasn’t all bad news though. While we’re not charting it here, know that Q2’s likely GDP growth rate improved from Q1’s 1.4% to 2.8%, versus expectations of only 2.1%. At the same time (and again), we’re not charting it here), personal spending remained firm in June, although income growth cooled just a bit.
This is data the Federal Reserve considers when determining interest rates. And, given this latest round of information, there’s no new pressure to lower them ASAP. The odds are still that we’ll see one in September, and one more one in November, and then one more in December. We’re NOT expected to see a rate cut this coming week, however, although a decision on the matter is scheduled.
Finally, we got the third and final look at the University of Michigan’s consumer sentiment score for Julye last week. Although our chart below only shows it through June, this month’s reading of 66.4 is down (again) from June’s 68.2.
Consumer Sentiment Charts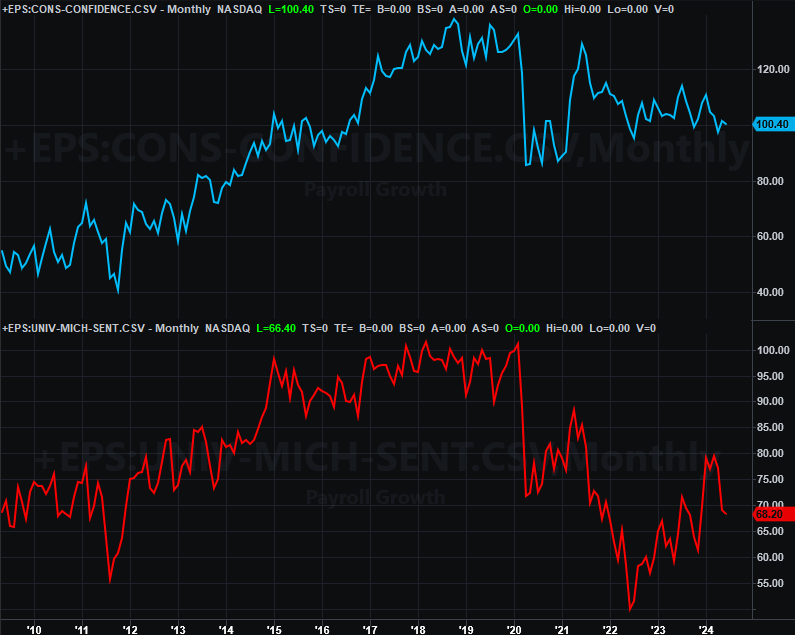
Source: University of Michigan, Conference Board, TradeStation
The Conference Board’s consumer confidence score will be posted on Tuesday of this week. It likely fell as well.
Everything else is on the grid.
Economic Calendar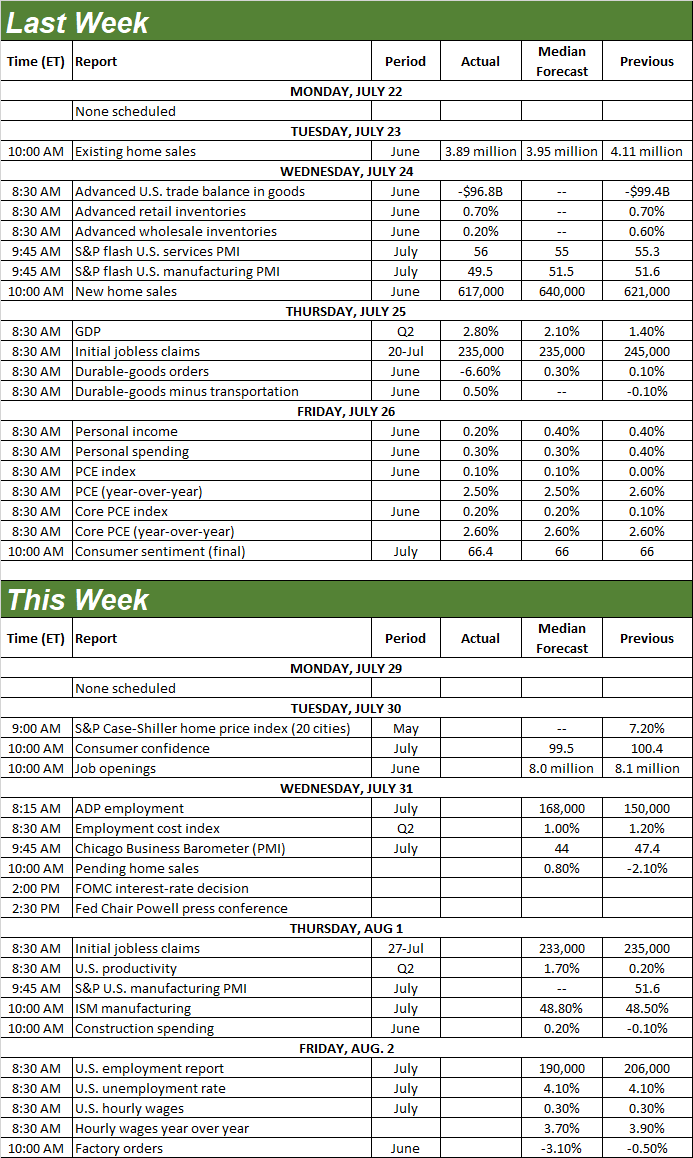
Source: Briefing.com
This week’s a biggie for several different reason. In addition to the Conference Board’s consumer confidence data, we’ll get updates on the aforementioned home prices. The S&P Case-Shiller Index is due on Tuesday, along with the FHFA’s home price index. Each has been moving higher of late, and likely will this time too (for May). But again, these numbers don’t tell the whole story.
Home Price Index Charts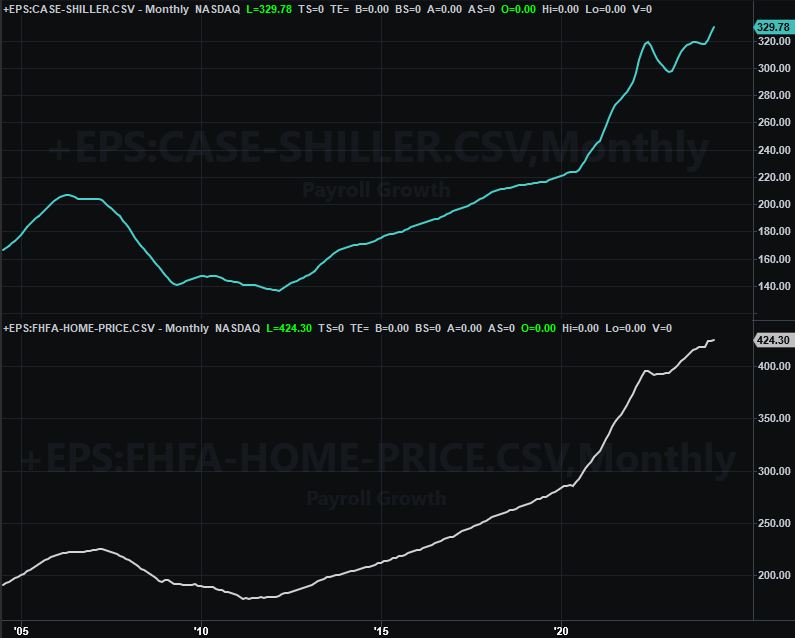
Source: FHFA, Standard & Poor’s, TradeStation
We’ll also start to hear the Institute of Supply Management’s measures of economic activity this week, with Thursday’s look at its manufacturing index. It’s expected to tick a little higher from June’s reading of 48.5, but it’s still likely to remain below the important 50 mark.
ISM Index Charts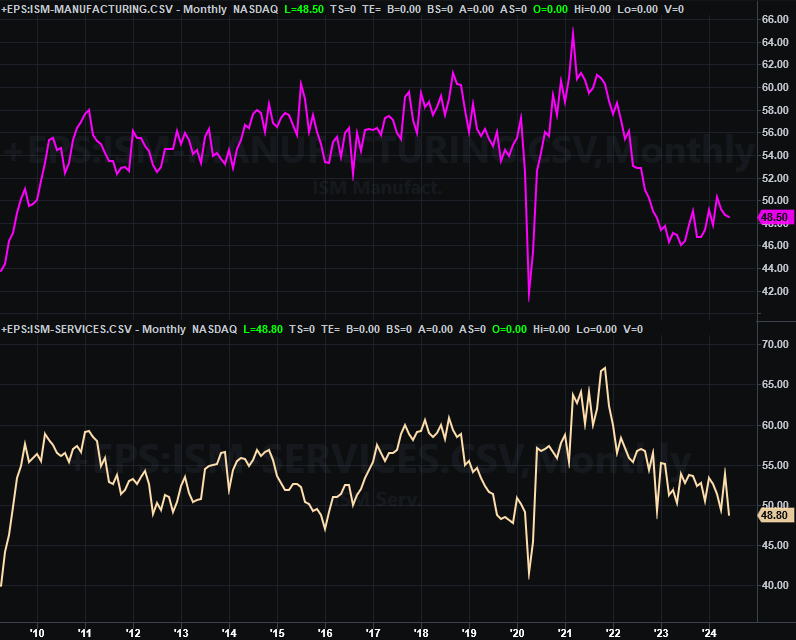
Source: Institute of Supply Management, TradeStation
The ISM Services report for July is coming next week.
Last but not least, we’ll get July’s jobs report on Friday. You may already know payroll growth is dwindling, but not necessarily because there are fewer people accepting open positions. The actual unemployment rate is ticking higher too, reaching a multi-year high of 4.1% in June. Forecasters aren’t calling for any improvement of either this time around.
Unemployment Rate, Payroll Growth Charts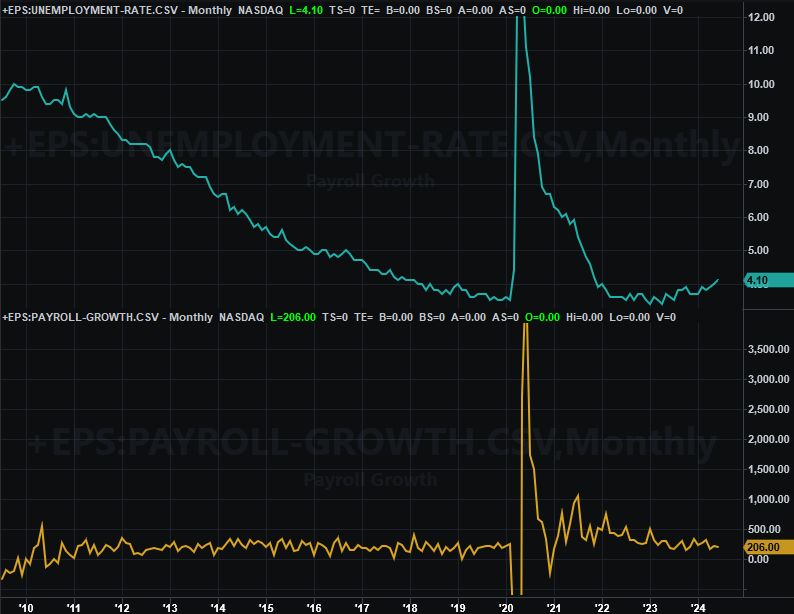
Source: Bureau of Labor Statistics, TradeStation
Although we don’t chart it, you should know that the total number of officially-unemployed people also pushed to a multi-year high of 6.81 million last month, while the total number of employed individuals in the United States peaked at 161.86 million in November and has since been dwindling, falling to 161.2 million in June. Like it or not, the jobs market is NOT hot anymore.
Stock Market Index Analysis
In many ways last week’s action isn’t entirely surprising. The market was already overbought earlier this month, and for the NASDAQ Composite anyway, also bumping into the most likely technical ceiling (at 5,655) suggested the cup-and-handle pattern that first started taking shape in 2022. The prior week’s tumble was also a pretty good jolt… the kind of move that makes people fear a bigger correction is underway. This of course begets more selling, which is what we saw take shape last week.
Except, there’s a reasonably good chance all the selling that was in the cards has already been done, setting the stage for a resumption of the bigger bullish trend.
The weekly chart of the S&P 500 below puts it in perspective. Namely, it shows us a potential floor connecting the prior two major lows (yellow, dashed) may now be in play as support. In the same vein, the S&P 500;s Volatility Index (VIX) may have also just bumped into a technical ceiling (pink, dashed) that corresponds to the support line that’s been holding the composite up since the “handle” formed late last year.
S&P 500 Weekly Chart, with VIX and MACD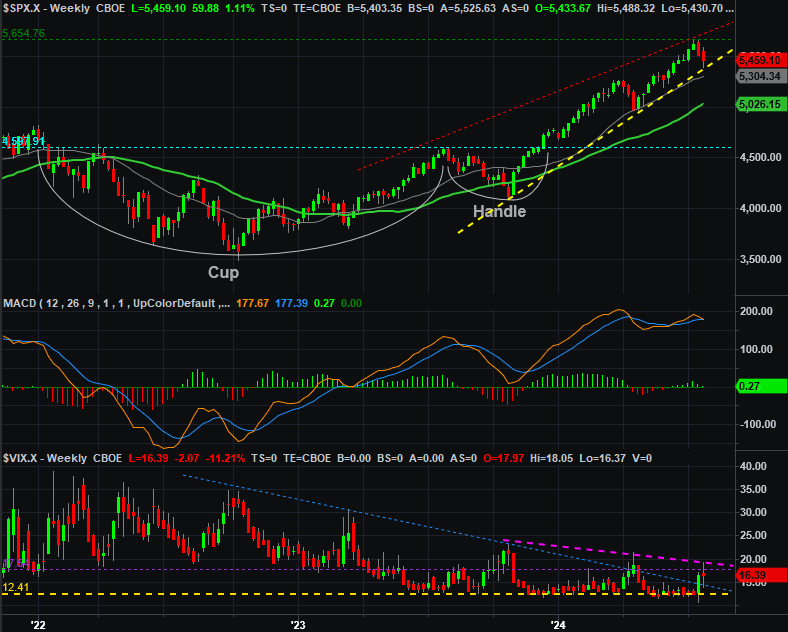
Source: TradeNavigator
In other words, everything that happened last week was at least a little bit predictable, and perhaps a little bit predictive as well. More to the point, there’s a case to be made that the bulls have drawn a line in the sand here, and aren’t going to let stocks slide any lower.
The daily chart of the S&P 500 offers up a little more detail on how it all happened. This chart also shows us the 50-day moving average line (purple) may be a bit of a battleground, aligning with the near-term support line that extends back to October’s low.
S&P 500 Daily Chart, with VIX and Volume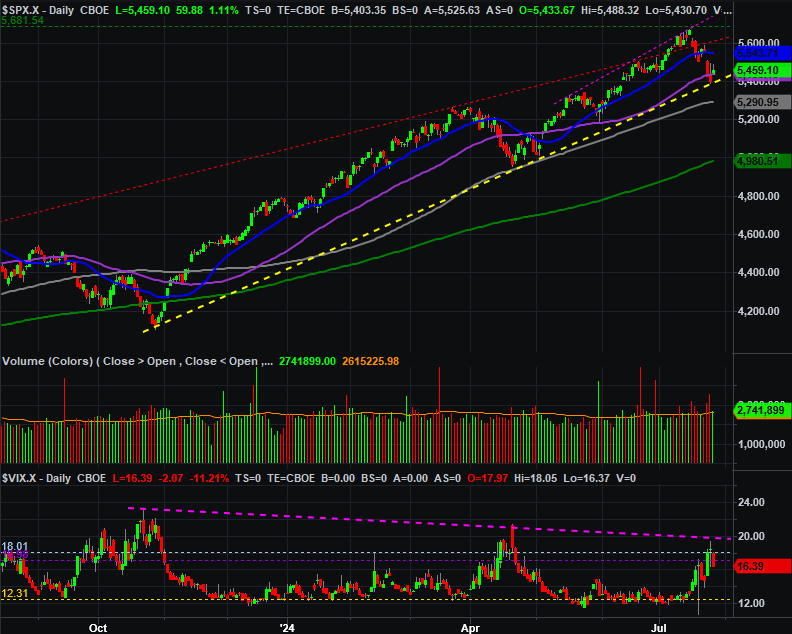
Source: TradeNavigator
The NASDAQ Composite looks similar, but not identical. It didn’t reach all the way up to its cup-and-handle target near 19,100 (green, dashed), but it did bump into a technical ceiling that connects all the peaks going back to the bottom of the “cup” (red, dashed). That’s an important ceiling. On the flipside, the composite has yet to test one key technical floor…. the support (yellow, dashed) connecting the major lows since October’s bottom.
NASDAQ Composite Weekly Chart, with MACD and Volume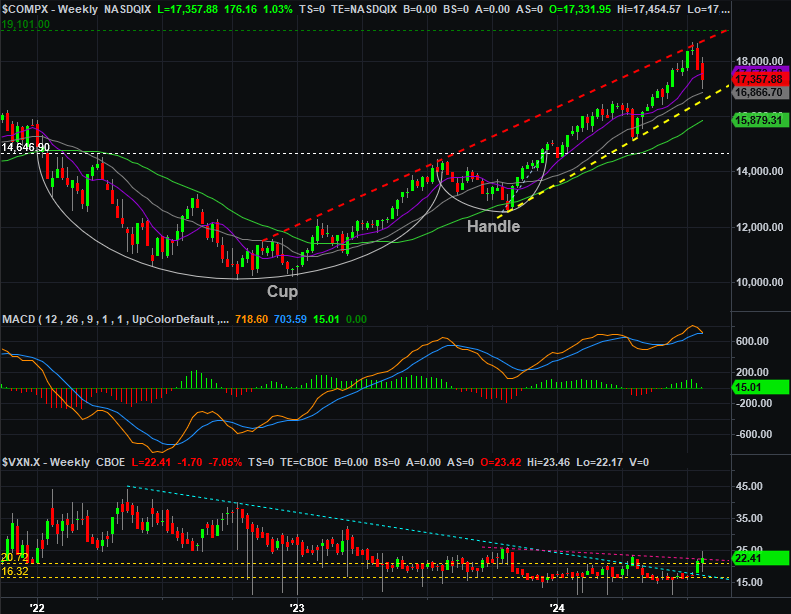
Source: TradeNavigator
The daily chart of the NASDAQ Composite provides some more detail on this action, also highlighting the potential floor around 16,840, where the straight-line support and the 100-day moving average line (gray) will be converging right around the time that floor can be tested. The daily chart also shows us a close under the 50-day moving average line (purple) at 17,528 though, so any support from here would be much appreciated by the bulls.
The most noteworthy feature of the NASDAQ Composite’s daily chart, however, is actually the NASDAQ Volatility Index’s (VXN) recent action. It poked above all of its most meaningful ceilings as of last week, suggesting traders are truly starting to lean bearishly as of last week. If they’re thinking it, they’re very likely to make it happen, creating a self-fulfilling prophecy.
NASDAQ Composite Daily Chart, with VXN and Volume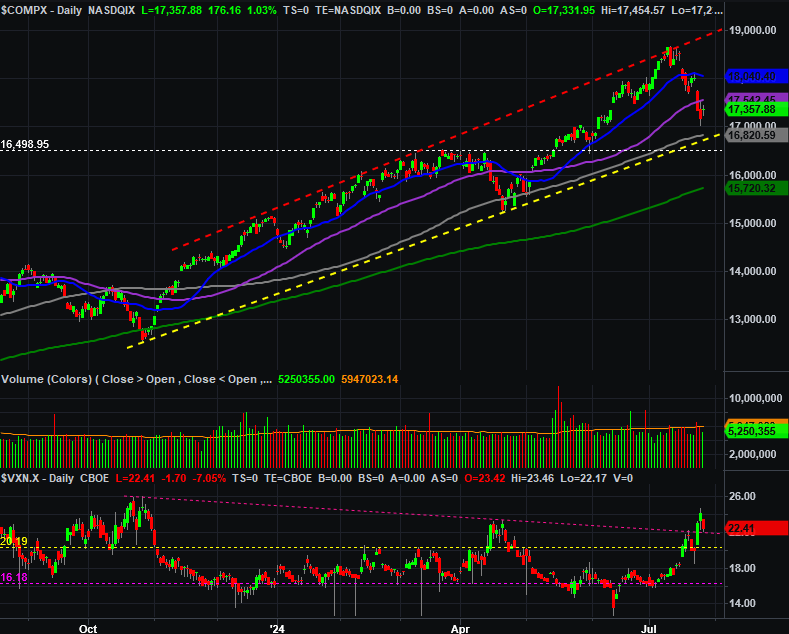
Source: TradeNavigator
So what are we saying here? That’s just it -- we’re not saying much of anything. We’re simply pointing out that both of the indices are largely in limbo right now, equally capable of moving in either direction from here. No-man’s land, if you will. The smartest move right now is arguably doing nothing and letting either the bulls or the bears tip their hand a little more clearly.
That being said, we still contend the philosophical path of least resistance remains to the downside. We’ll give warning signs to that effect a little extra credence.