Weekly Market Outlook – Another Week, Another (Sloppy) Win

The market was all over the map last week, but when all was said and done, Friday’s encouraging jobs report led stocks to their fourth consecutive weekly win. The wins are getting weaker though. Perhaps traders recognize stocks are still a little too overbought thanks to a rally that’s really been underway since early 2022; there just haven’t been enough meaningful capitulatory corrections since then.
Then there’s the other curious thing.
We’ll look at all of it below, but first, let’s run through last week’s economic reports and preview what’s coming this week. September’s jobs report posted on Friday is of course the one that dragged the market out of the red and into the black for the week.
Economic Data Analysis
While the employment data was clearly the biggie, it wasn’t the only noteworthy news from last week. The Institute of Supply Management’s manufacturing index was updated on Tuesday, with the services index being posted on Thursday. Manufacturing activity remains lethargic (below 50), but the services index was markedly better than expecting, reaching a 20-month high of 54.9%.
ISM Services, Manufacturing Index Charts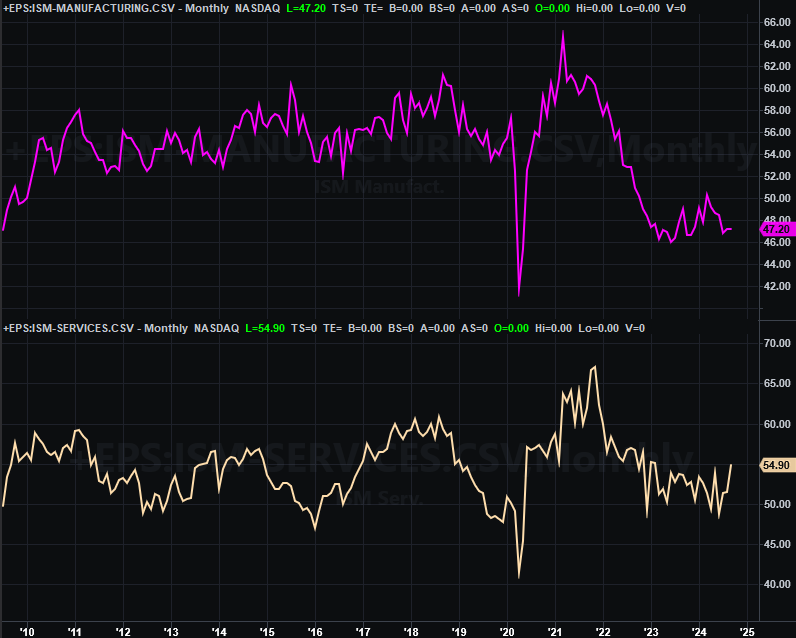
Source: Institute of Supply Management, TradeStation
One good month doesn’t make a trend, but it is something to build on.
As for the jobs data, you likely already know the numbers. Thanks to the pleasantly-surprising addition of 254,000 new jobs, the unemployment was ratcheted own -- again -- to 4.1%. Traders saw it as a bullish sign, even if it is apt to slow the Fed’s expected pace of rate cuts in the foreseeable future.
Payroll Growth, Unemployment Rate Charts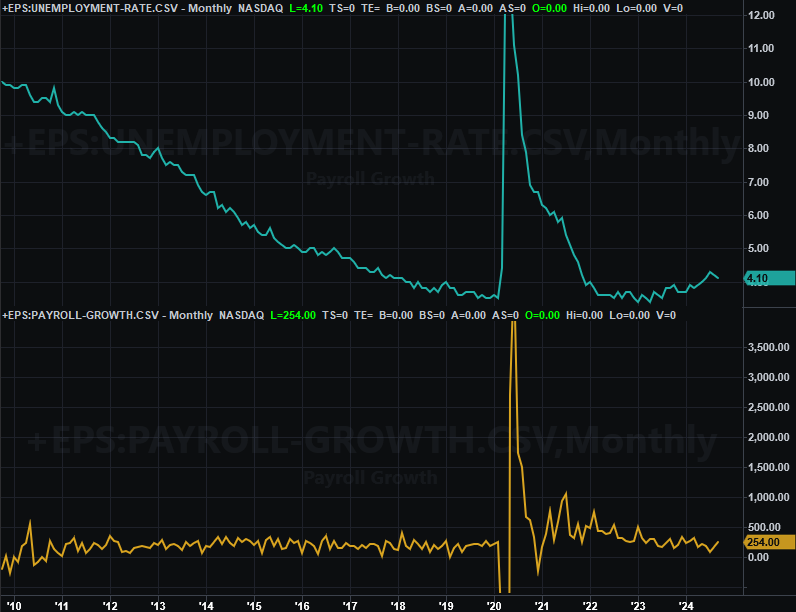
Source: Bureau of Labor Statistics, TradeStation
And it is a victory, although hardly a resounding one. Again, one month doesn’t make a trend. Neither does two, for that matter. The employment situation is still wobbly at best.
Everything else is on the grid.
Economic Calendar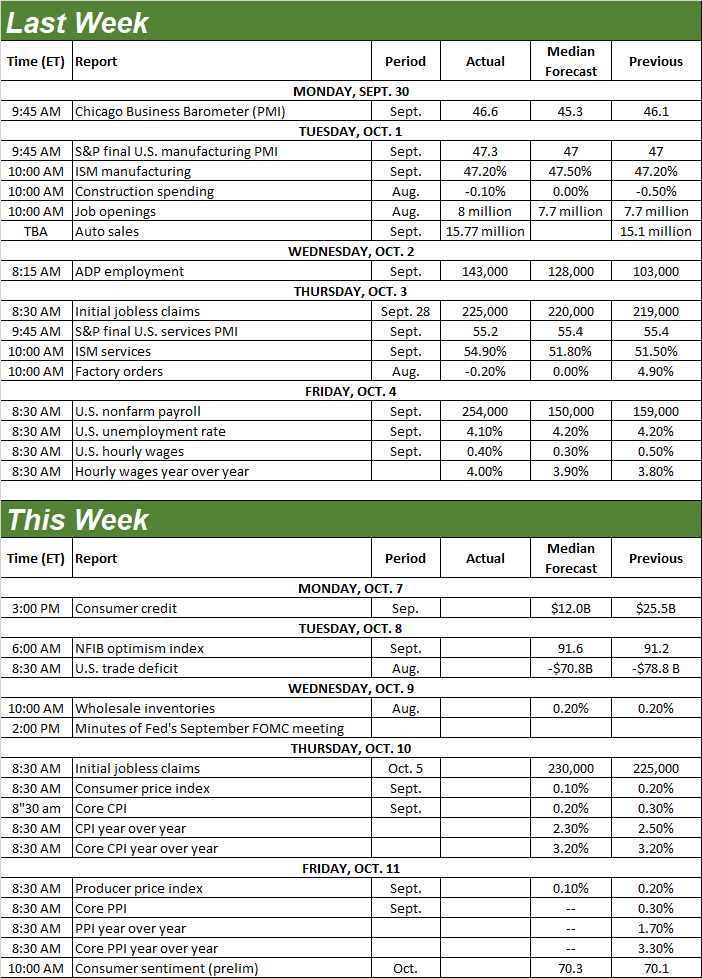
Source: Briefing.com
This week isn’t going to be a busy one, but we’re going to get another round of news that puts the spotlight on the Federal Reserve’s handling of interest rates. We’ll hear last month’s consumer inflation report on Thursday, with producer inflation data due on Friday. Forecasters are calling for the same basic rates seen a month ago, which are more or less in line with the Fed’s long-term targets.
Producer, Consumer Inflation Rate Charts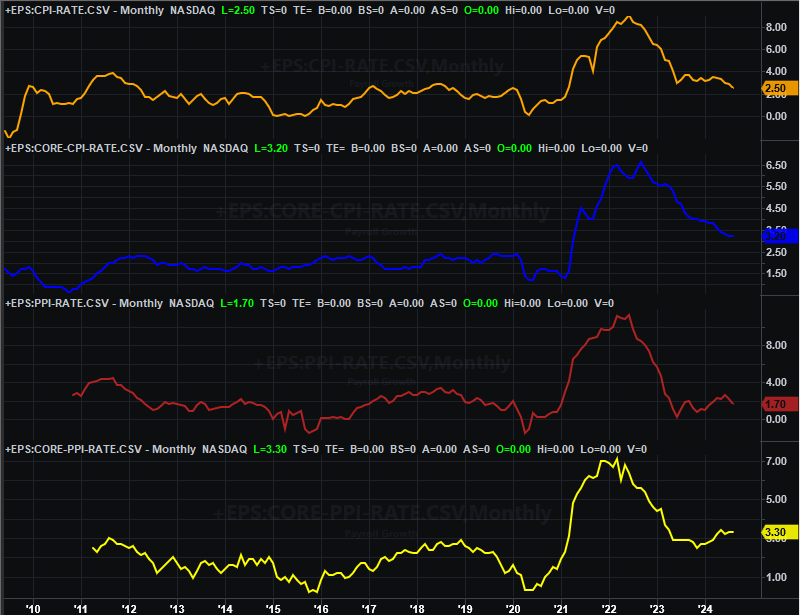
Source: Bureau of Labor Statistics, TradeStation
Although we’ll likely see numbers that match August’s, overall inflation is being curbed in a bigger-picture sense. In light of healthy consumer spending and reasonably-rising income, even the slightest hint of rekindled inflation growth could put the brakes on the FOMC’s current plans to make several gradual rate cuts through 2026.
Stock Market Index Analysis
The S&P 500 gained a mere 0.2%... the worst win of the past four bullish weeks. The market continues to make progress, but it is slowing down. Still, progress is progress.
S&P 500 Weekly Chart, with VIX and MACD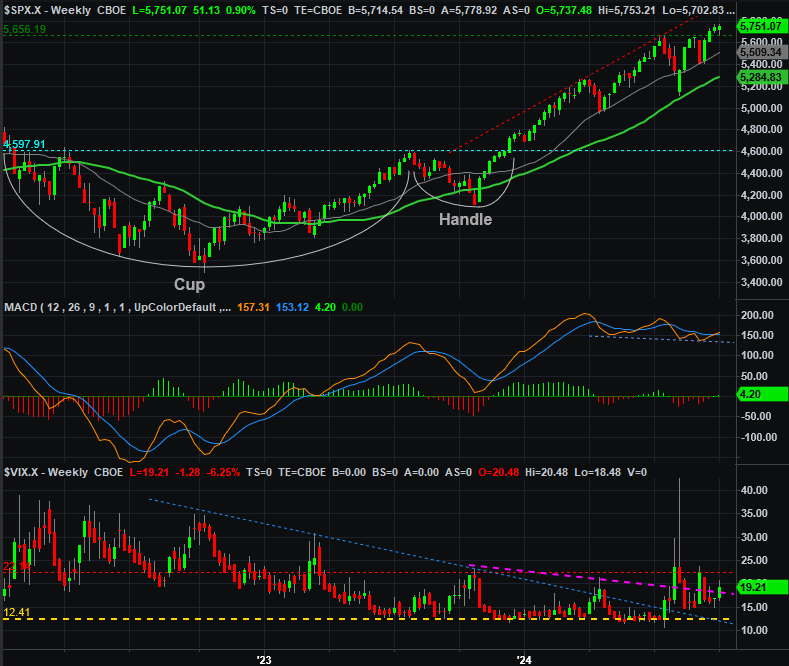
Source: TradeNavigator
There’s a slight problem with the concern, however. That is, while the forward progress has been slowing down for the past three weeks, we also got a bullish MACD crossover last week. Making matters even more confusing is the fact that the S&P 500’s Volatility Index (VIX) bounced higher last week. When stocks are moving higher, the VIX typically goes lower. Why is the VIX inching higher here then? That’s just it. Although traders are still buying stocks (albeit in a very shallow, low-volume way), the rising VIX also suggests they’re at least thinking a bit defensively.
And the NASDAQ Composite looks pretty similar. We don’t yet see a bullish MACD cross here, and the NASDAQ’s Volatility Index (VXN) isn’t exactly soaring. It is up though, and the composite itself is making slowing bullish progress too. Also like the S&P 500, the NASDAQ Composite is above all of its key moving average lines. Even if not at record highs like the S&P 500 is, that’s still bullish.
NASDAQ Composite Weekly Chart, with VIX and MACD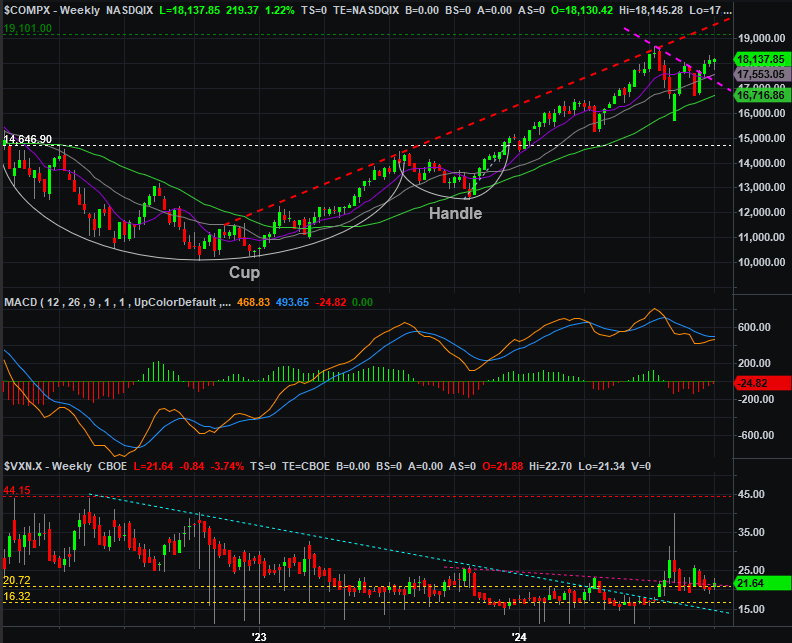
Source: TradeNavigator
Drilling into the more-detailed daily chart of the S&P 500 shows us a couple of important details. Chief among them are the facts that the index hasn’t yet hurdled the previous week’s record high of 5,767 (blue, dashed), and the gains seen late last week were truly on below-average volume. Also note, however, that what used to be a technical ceiling (green, dashed) at 5,668 appears to have turned into a floor, preventing the S&P 500 from sinking too much on Wednesday and Thursday.
S&P 500 Daily Chart, with VIX and Volume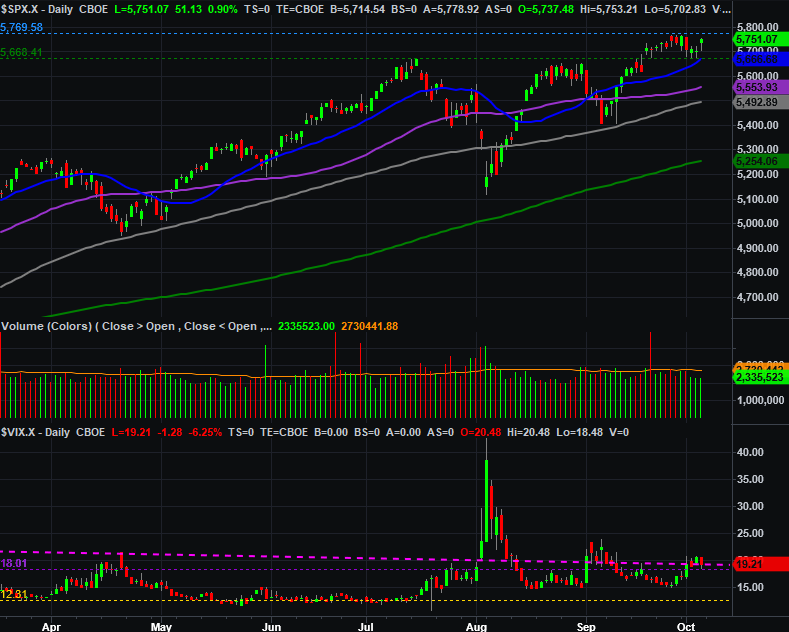
Source: TradeNavigator
Here’s the daily chart of the NASDAQ Composite, not that it sheds any additional light on things. Like its counterpart, the NASDAQ is above all of its arguable technical support.
NASDAQ Composite Daily Chart, with VXN and Volume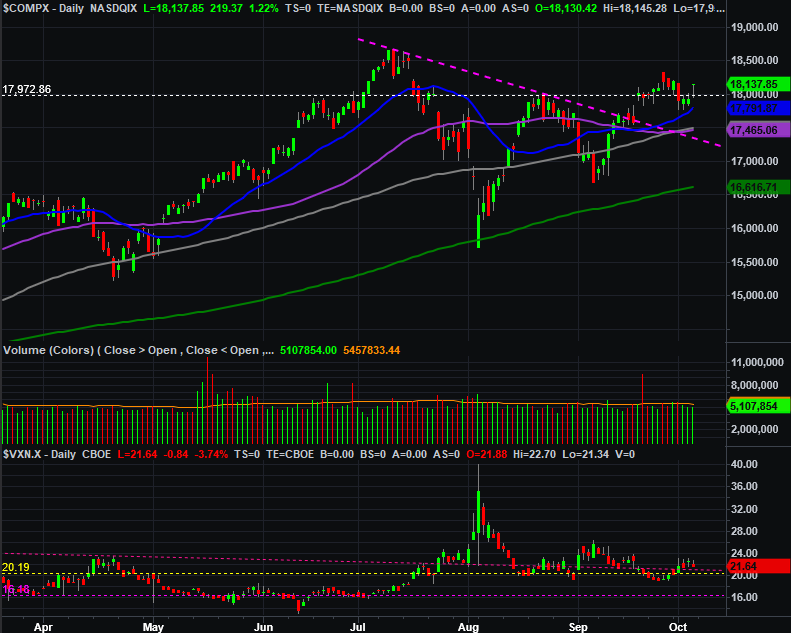
Source: TradeNavigator
So what’s the call? This is the sort of setup that traders generally hate (and try to avoid), since it’s so inconclusive. The undertow is technically and superficially bullish, but that’s arguably the last thing we want to see at this time. It’s been months since we’ve been through a much-needed capitulatory correction. We’re still due. The market just doesn’t seem ready, willing, or able to make it happen. Given that the trend is your friend, stay bullish here. Just keep it all on a short leash.
The good news is, the proverbial line in the sand is crystal clear. There’s a convergence of moving average lines for the NASDAQ Composite in the narrow band between 17,465 and 17,792. If the composite breaks under that range, it’s not necessarily the end of the world -- we saw it happen in August and then again in September to no avail. But, in those two cases the plunge happened so abruptly that it set up an immediate dead-cat bounce. If the composite slides under this support at a more measured pace, that actually could be trouble.
Of course, the VXN will need to “play along” by making a well-formed, sustainable upward move. We’re seeing something a little like that now, but not convincingly so.
In the meantime, the path of least resistance technically remains bullish.