Weekly Market Outlook - Reasons For Caution Here
BigTrends.com Weekly Market Outlook
Talk about a 180-degree turnaround! Traders were bullish leading up to last Wednesday's big news, and remained a little bullish for the last part of that session. With a night to sleep on it though, they changed their minds. Thursday as bearish and Friday was even more so, turning what started out as a great rebound effort into a weekly loss as well as a break below several key support levels.
If a Santa Claus rally is in the cards, the bulls are going to have to start with a lot of damage control.
We'll poke and prod the rekindled downtrend below, after a quick examination of last week's and this week's biggest economic news.
Economic Data
The week was plenty loaded with economic news, though the highlight of it all was the least surprising... the Federal Reserve (after months of warning investors) pumped up the Fed Funds Rate from 0.25% to 0.5%. It's a sign that the economy can finally withstand higher rates, and that the economy may finally be solid enough to begin driving inflation.
Investors initially agreed with the Fed's enthusiasm from Wednesday, though by Thursday the tide has turned for the worst, turning a bullish week back into a bearish one. It's anyone's guess as to how investors will feel when trading resumes this week.
Other big - and related - news is November's inflation report. On a core (ex-food and energy) basis, it was up 0.2%, and flat overall. On an annualized basis, the overall inflation rate stands at 0.5%, and is up 2.0%. That's in line with the Fed's target, and a reason to start quelling rampant economic growth before inflation ramped out of control.
Consumer Price Inflation Chart
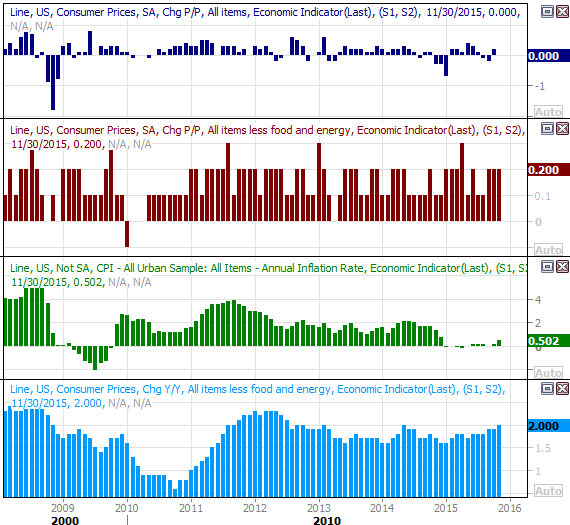
Source: Thomas Reuters
November was also a good... no, great month for real estate. Housing starts jumped from a pace of 1.062 million to 1.173 million, while permits grew from a pace of 1.161 million to 1.289 million. Both are near multi-year highs again, and it's possible they could have been even stronger were there more inventory available.
Building Permits and Housing Starts Chart
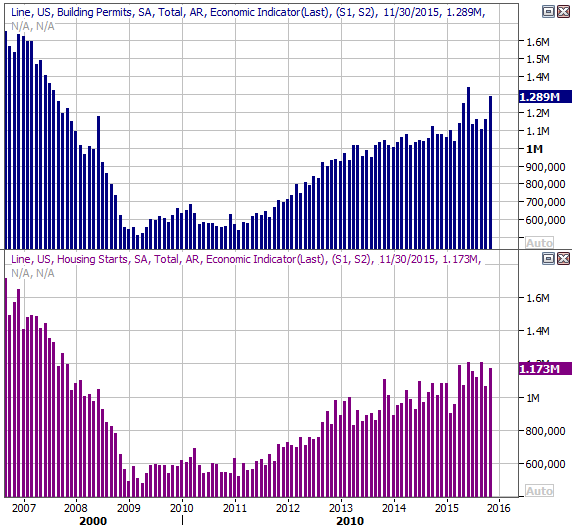
Source: Thomas Reuters
It wasn't all encouraging news last week, however. Capacity utilization and industrial production were both down, and not necessarily for the first time of late. Given the strong correlation between the long-term market and this data, this is cause for concern.
Industrial Production and Capacity Utilization Chart

Source: Thomas Reuters
All the other data is on the following grid:
Economic Calendar
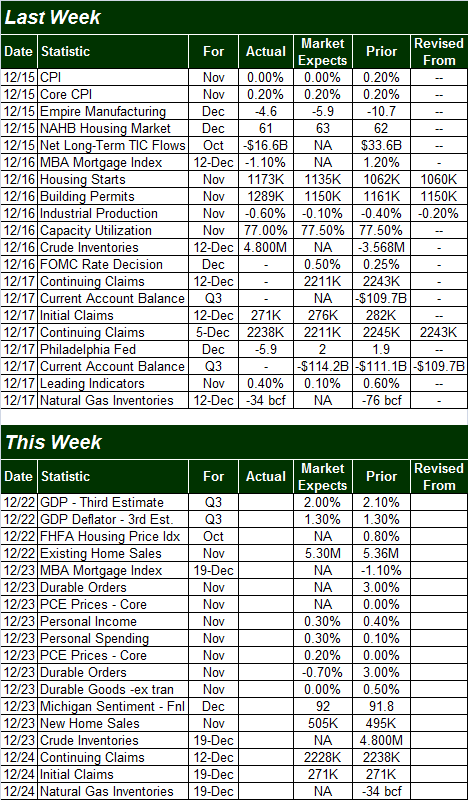
Source: Briefing.com
This week won't be quite as busy, though we're getting some biggies.
One of them is the third and final reading for Q3's GDP; economists think we'll log 2.0% growth.
It's also going to be a big week for real estate data again. This time we'll hear last month's existing home sales and new home sales. Existing home sales should ratchet up slightly to a pace of 5.4 million, while new homes should sell at a pace of 500,000 units per year, up slightly from October's reading of 495,000 houses. Both could use a good shot in the arm.
Existing and New Home Sales Chart
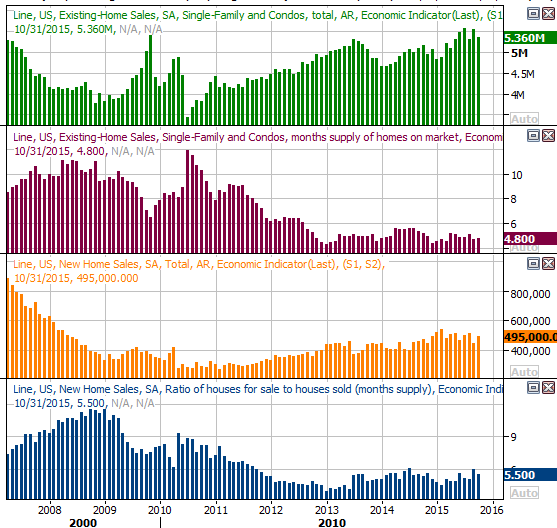
Source: Thomas Reuters
Stock Market Index Analysis
In retrospect, one can't help but wonder if the bullishness seen early last week leading up to the Fed Funds rate decision on Wednesday was the exception to the trend rather than an indication of the market's current mood. We've now logged a second lower high since the late-October peak, and we've also not logged a second lower close for the same timeframe. Though still volatile, the trend is technically bearish, and close to being confirmed a such.
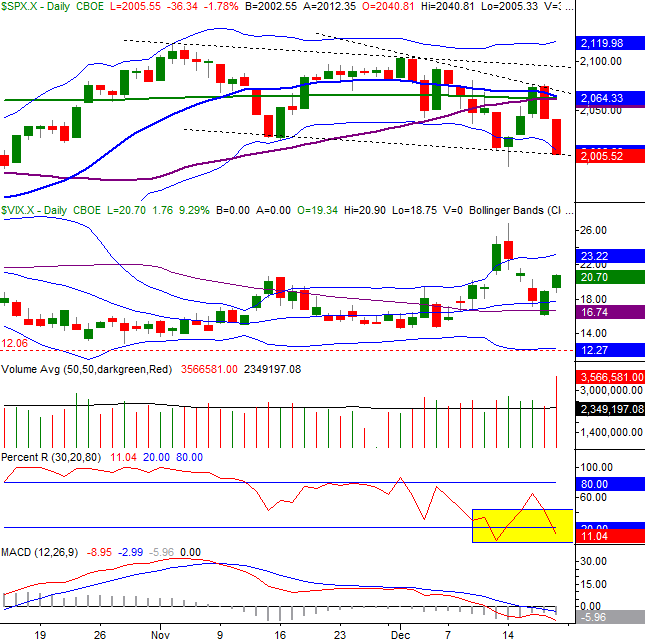
None of this is difficult to make out on the daily chart of the S&P 500 (SPX) (SPY). The lower lows and lower highs are all framed by dashed lines. You can also see the S&P 500 index has broken back under its lower Bollinger band, this time with some decisiveness. Yet, with the CBOE Volatility Index (VIX) (VXX) not even back up to recent highs let alone highs hit just a few weeks ago, there's still plenty of psychological room for stocks to pull back before traders start to feel the "enough is enough" speculative buy-in itch.
S&P 500 & VIX Daily Chart
Chart created with TradeStation
It's not just the S&P 500's shape and momentum painting an alarming picture, however. Other technical tool are just as alarming. Take the MACD lines, for instance. Not only are we still in a (now renewed) bearish divergence according to the MACD lines, with both of the MACD lines now below zero, we know this trend is well-developed.
We can also see the Percent R line is back under the 20 threshold, which is at least the beginning of a bearish confirmation. The Percent R line will confirm a bearish trend when it moves higher without moving back above 20 and then starts to point lower again.
It's also concerning that the 20-day moving average line is about to break under the 50-day moving average line and the 100-day moving average line, suggesting the short-term momentum has taken a bearish turn.
The shape of the daily chart of the NASDAQ Composite (COMP) looks about the same as the S&P 500. That is, it's dancing with lower lows. But, it's already broken back under the key intermediate-term support line we've been eying since the previous week low (red, dashed). The composite also broke under the 200-day moving average line (green) on Friday.
NASDAQ Composite & VXN Daily Chart
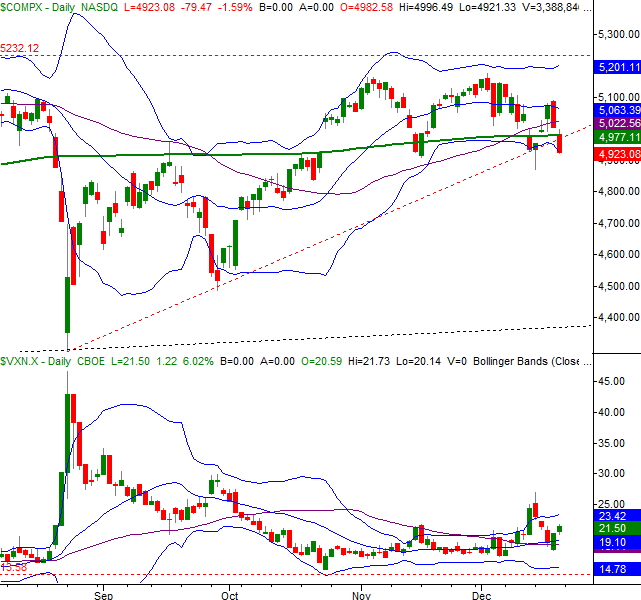
Chart created with TradeStation
The really alarming part of the NASDAQ's chart, however, is the Nasdaq Volatility Index (VXN).
Not unlike the VIX, while the VXN edged a little higher late last week but is still well under levels that could be considered so high that it's bullish. In fact - and this is the scary part - it looks like the VXN is at the beginning of a budding uptrend. If the VXN is truly starting to trend higher as opposed to just surging higher, it's a suggestion of a more philosophical bearish pressure on the market.
Even so, it's the weekly chart of the NASDAQ that once again may have the most meaning right now, as last week's dip has left it sitting right on top of a very important intermediate-term support line at 4870. If it breaks, that could be trouble, but that's a very big "if".
NASDAQ Composite & VXN Weekly Chart
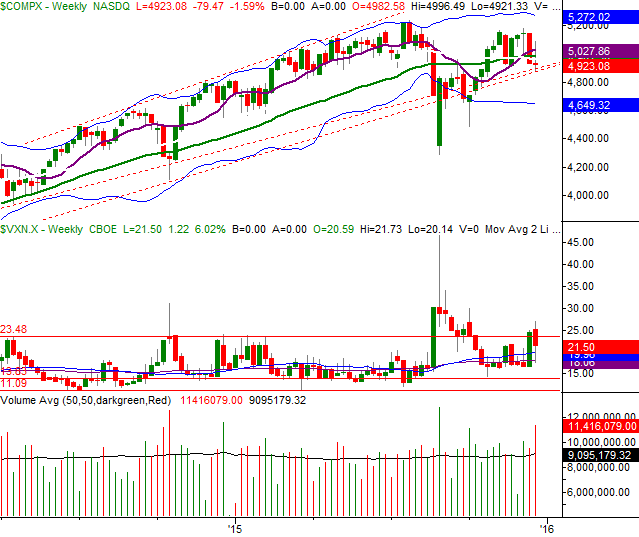
Chart created with TradeStation
Before assuming this bearish effort is going to get any more traction this week, though, two things must be embraced. One is, we're now at a time of year when a Santa Claus rally usually materializes. The other is, Friday was not only an option expiration day but also a triple-witching Friday where quarterly as well as monthly options expire. That could have been the only reason for such a bearish headwind. We won't know with more certainty until this week.
Whatever the case, be sure to keep an eye on the NASDAQ's support at 4870, and the S&P 500's resistance at 2063.
Trade Well,
Price Headley
BigTrends.com
1-800-244-8736