Weekly Market Outlook – The “Best Week of 2024” Leaves Behind a Few Problems

Following through on the previous week’s bullish intraweek reversal, stocks soared last week. In fact, the S&P 500’s 3.9% advance last week makes it the market’s best week since November of last year. It/s a convincing statement to any doubting bulls.
And yet, it’s far for an ideal move if you were hoping for more upside. There’s not a lot of room or reason to think the bulls will be able to keep chugging from here. A great deal of cleanup work needs to be completed first. It may not get done.
We’ll look at this worklist in a moment. Let’s first review last week’s wave of economic reports and preview what’s in the cards this week. The real estate picture is getting much clearer, although not necessarily for the better.
Economic Data Analysis
Buckle up.
The party started on Tuesday with last month’s producer inflation data. As was expected, it’s still cooling. It’s also still above the Fed’s target, but not alarmingly so. Producer inflation is now 2.9%, or 3.2% when factoring in food and energy costs. The overall consumer inflation rate stands at 2.9% now, per Wednesday’s report, while adding food and fuel to the calculation pumps it up to 3.2%.
Consumer, Producer Inflation Rate Charts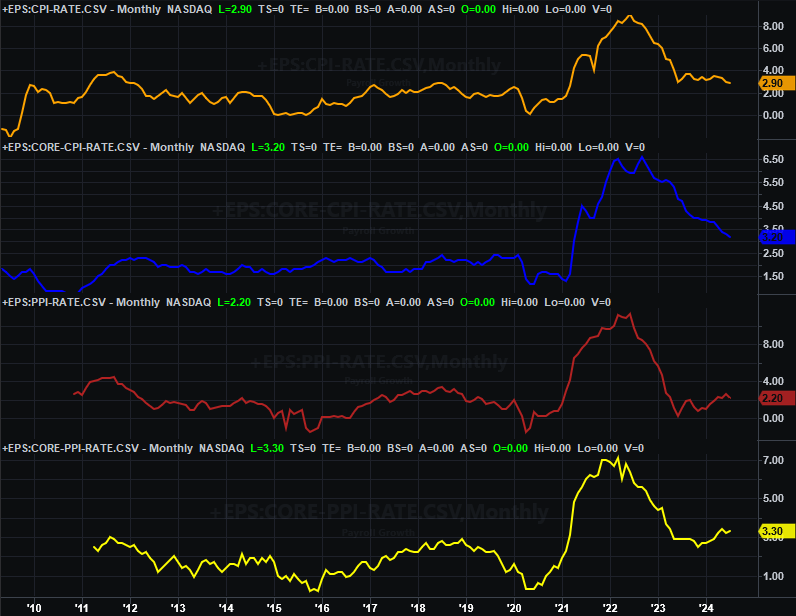
Source: Bureau of Labor Statistics, TradeStation
This gives the Federal Reserve room and reason to not be quite so aggressive with future rate cuts, which is one of the key reasons stocks did so well last week. As is stands right now, the market’s now only betting on one quarter-point cut next month, one in November, and maybe one in December. If inflation continues to be curbed, those odds will actually wane in favor of keeping rates closer to where they are.
Last month’s retail spending was also encouraging. After several months of relatively anemic consumerism growth, spending ins now (and persistently) growing again no matter how you measure it.
Retail Sales Charts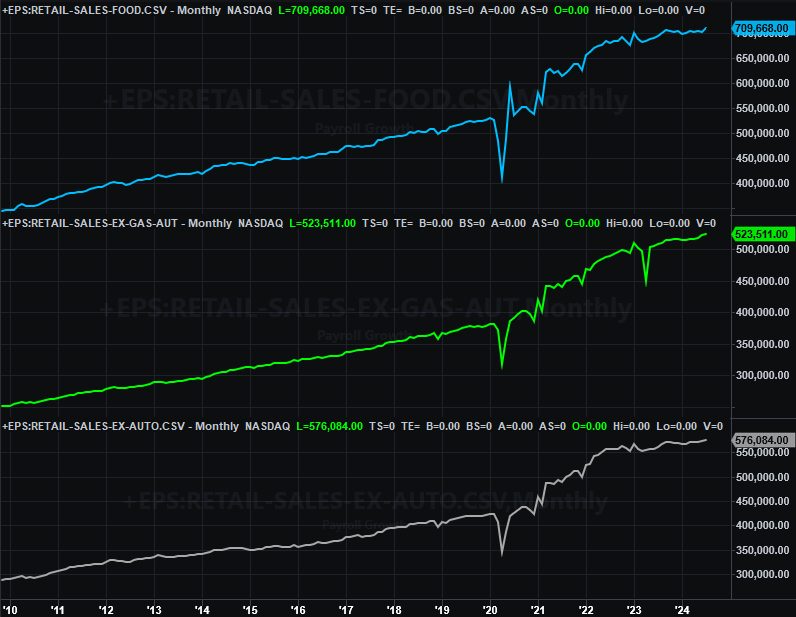
Source: Census Bureau, TradeStation
The irony? There are some minor red flags that suggest the economy may not be firing on quite as many cylinders as retail sales figure would imply. Last month’s industrial output fell more than a little bit, while the utilization of the nation’s factory-production capacity fell a little more.
Industrial Production and Capacity Utilization Charts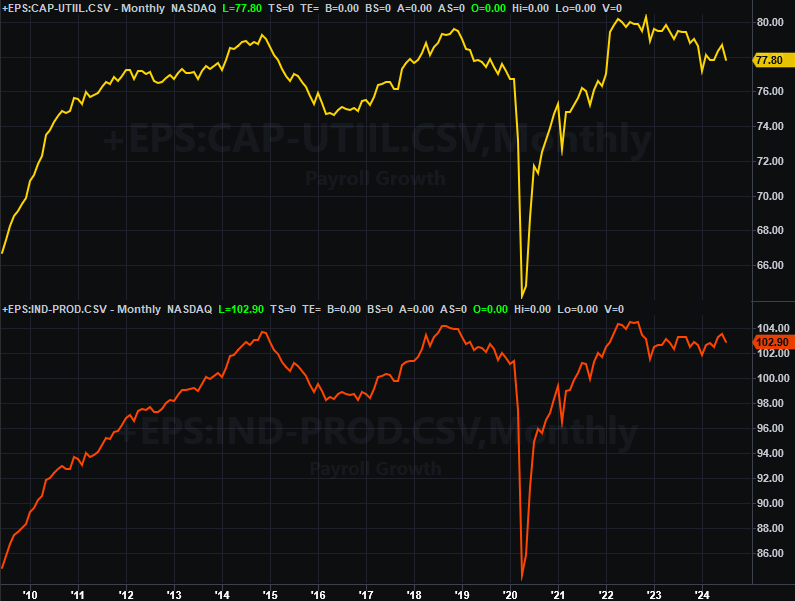
Source: Federal Reserve, TradeStation
One bad month doesn’t make or break a trend. But, it is a curious stumble at a point in time when the budding rebound is vulnerable. We’ll just have to wait and see if this is a temporary setback or the beginning of something. We do know, however, the link between capacity utilization and industrial production and corporate earnings and the market itself.
Finally, on Friday we heard July’s housing starts and building permits numbers. Not great. Both were already on the defensive, but got much worse. In fact, starts fell to a multi-year low pace of 1.24 million, while permits are testing new multi-month lows. Clearly demand is falling off. In this same vein, after a few months of bullishness, homebuilder confidence finally stumbled.
Housing Starts and Building Permits Charts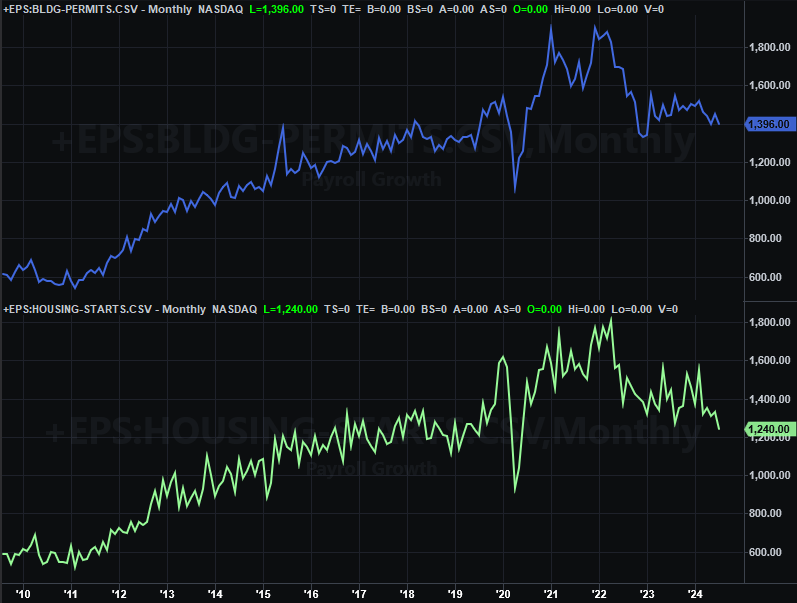
Source: Census Bureau, TradeStation
Everything else is on the grid.
Economic Calendar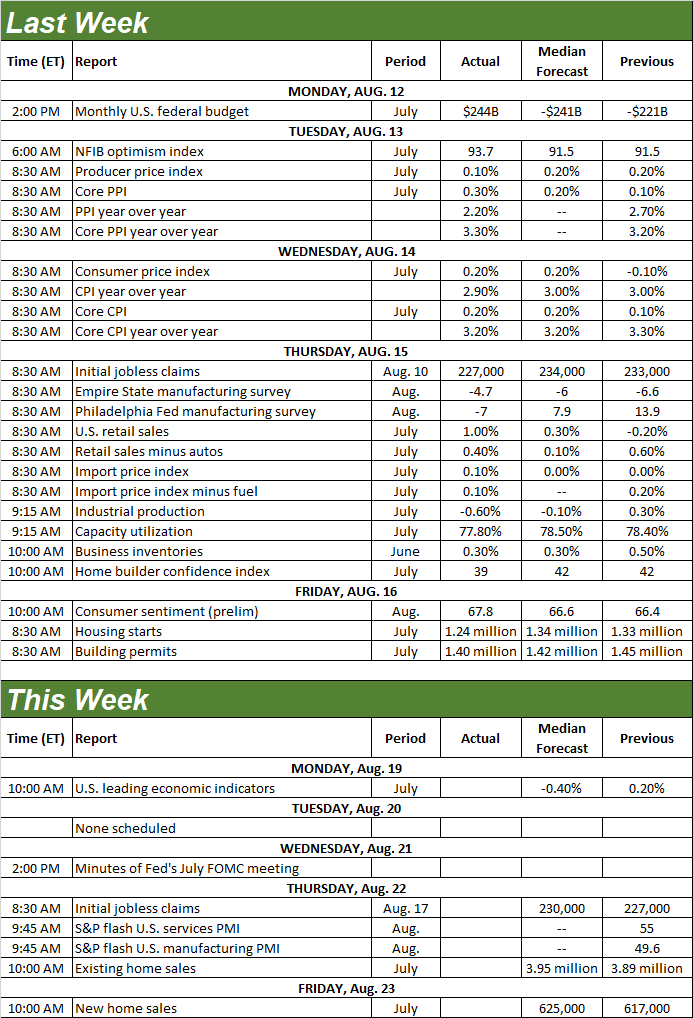
Source: Briefing.com
The only items in the queue for this week will round out the real estate picture. Look for July’s existing home sales number on Thursday, and new home sales on Friday. Forecasters believe we’ll see a slight improvement on June’s numbers. But, June’s numbers weren’t exactly thrilling. Sales remain at or near multi-year lows, with would-be buyers simply unwilling to pay sky-high prices.
New, Existing Home Sales Charts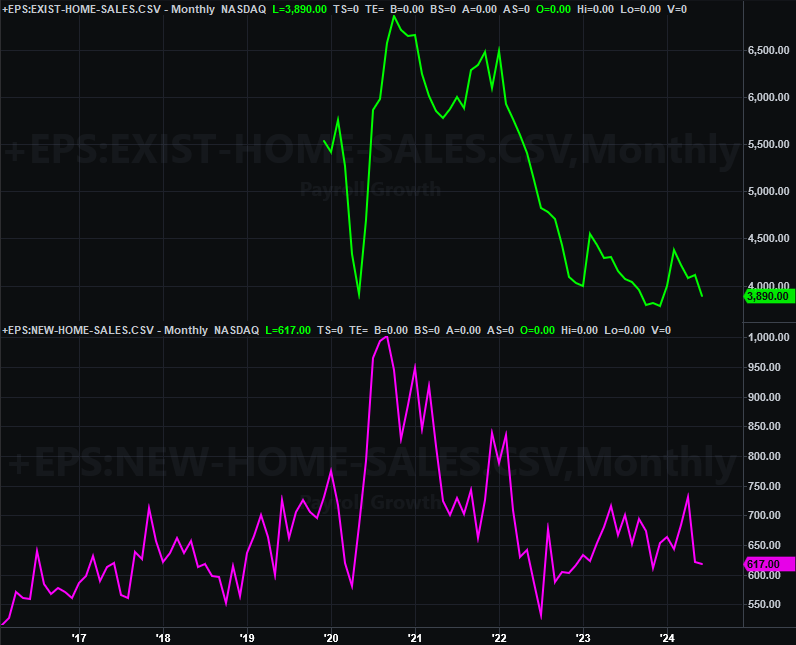
Source: National Assn. of Realtors, Census Bureau, TradeStation
Stock Market Index Analysis
The bulls certainly picked up where they left off the prior week, continuing their romp higher. Both of the indexes we normally actually cleared some key technical hurdles, in fact. But, it’s not quite the kind of follow-through we’d hope to see. It’s a little too strong to be trusted, yet there’s also not truly a ton of support behind the effort.
Take the S&P 500 as an example. As the daily chart below shows us, stocks soared again -- logging their best week since November, in fact -- to move back above the 50-day moving average line (purple) as well as back above a technical floor that extends all the way back to October of last year (yellow, dashed). That’s a decided momentum-based bullish clue.
S&P 500 Daily Chart, with VIX and Volume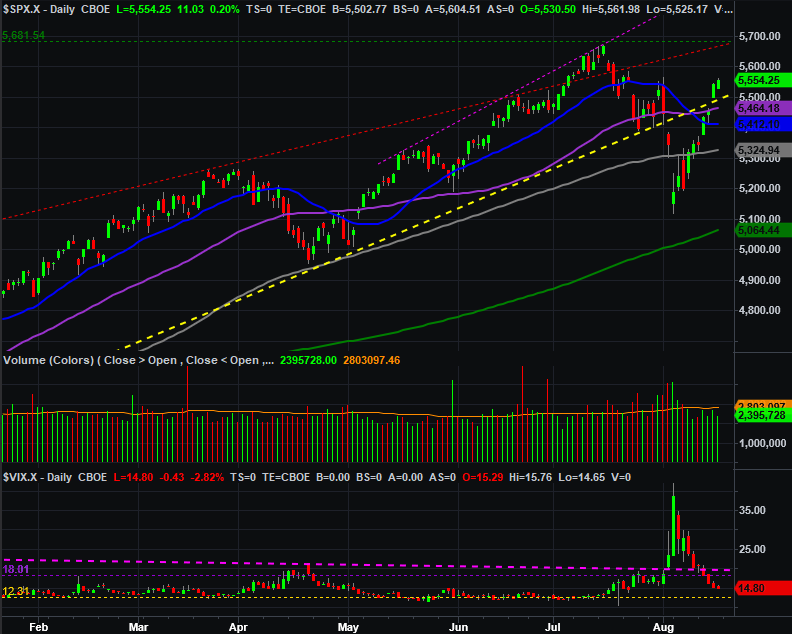
Source: TradeNavigator
Except, there are also a couple of red flags here. One of them is the gap left behind between Wednesday’s and Thursday’s session; the market generally doesn’t like to leave gaps unfilled. The more problematic detail here, however, is once again the lack of volume behind the advance.
The weekly chart puts things in perspective. Last week was really, really big, and most of the recent bullish legs of any bull market have started with a bang. Maybe this one will end up doing the same. It’s almost a little too good though. Either way, notice that July’s high of 5,655 still hasn’t been topped. That’s the real litmus test here (and headed into a time of year that’s known for bearishness).
S&P 500 Weekly Chart, with VIX and MACD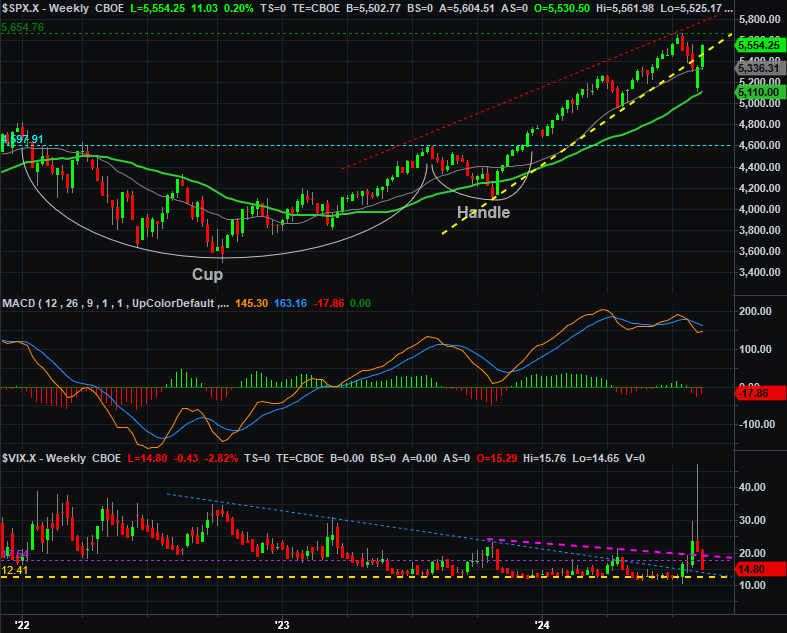
Source: TradeNavigator
The NASDAQ Composite looks similar, although not identical. Like the S&P 500 there’s just not a lot of volume behind the rally. Unlike the S&P 500, the NASDAQ looks like it’s struggling to even test the 50-day moving average line (purple) at 17,579. Between that and its Wednesday/Thursday gap, there’s good reason for doubt.
NASDAQ Composite Daily Chart, with VXN and Volume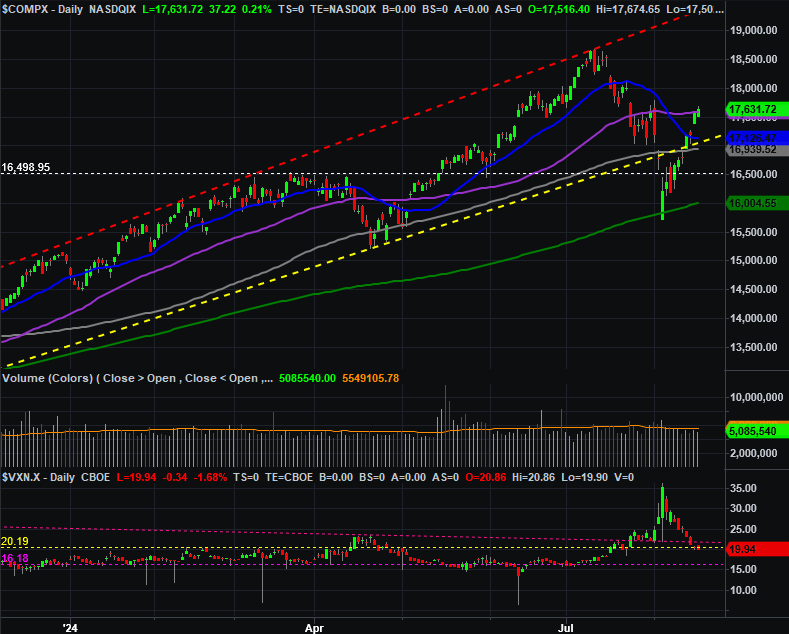
Source: TradeNavigator
It’s just not clear how things are shaping up or shaking out. The past two weeks have just been so incredibly unusual.
In any case, while we’re waiting for the market to find its bearings, it’s worth reminding you what typically happens around this time of year, and where we’re starting things out this time around. Take a look. We’re well up compared to even the average bullish year, and miles above where we’d be in the average year.
S&P 500 Yearly-Cumulative Performance Chart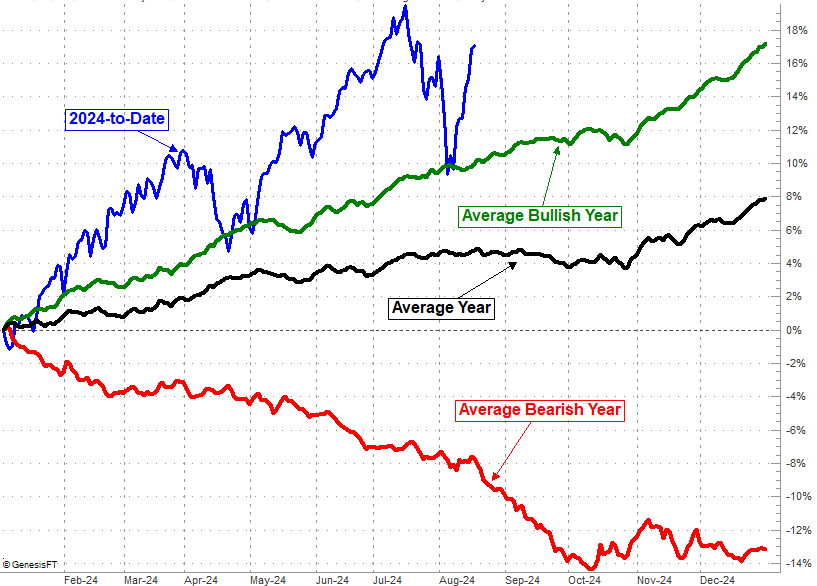
Source: TradeNavigator
Whatever the case, things are apt to at least slow from here… maybe through mid-October. This is one reason we’re not so trusting of this recent bullish effort.