Weekly Market Outlook – The Bulls Go 5 For 5. When and Where Will It End?

The bulls made last week the fifth consecutive winner, picking up steam from the prior week’s anemic advance. As was noted in last week’s market outlook, although stocks are overdue for a correction, the path of least technical resistance remains upward. The optimistic spin on last week’s inflation data helped. Ride this bullish train until it’s clear you can’t anymore.
If you’re hesitant to dig in though, that’s certainly understandable.
We’ll talk about that in a second. Let’s first look at last week’s big economic news and then preview what’s coming this week.
Economic Data Analysis
There was really only one data set of interest posted last week. That’s September’s inflation numbers, of course. We’ve still got it. It’s not painfully high any longer. It’s not exactly abating though. Let’s just say it’s still high enough that there’s doubt that the Federal Reserve can justify the streak of gradual rate cuts that it was planning for the next couple years.
Producer, Consumer Inflation Rate Charts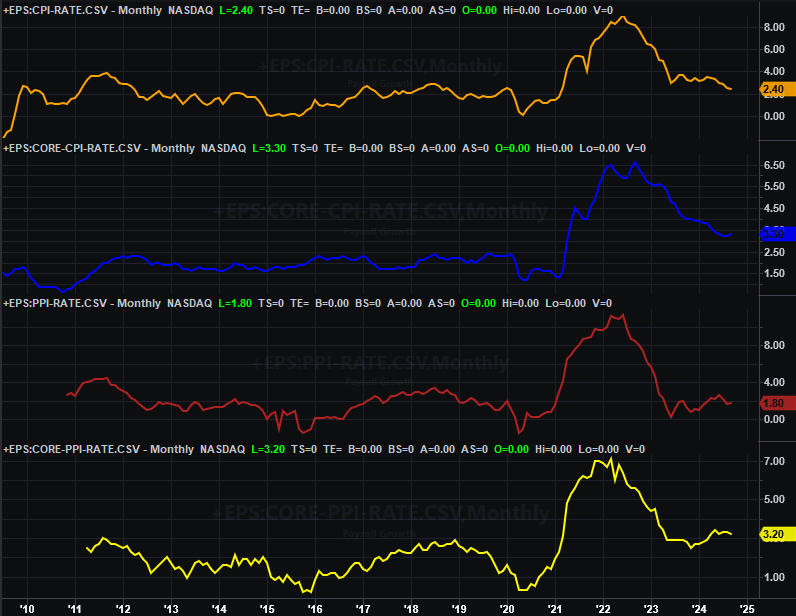
Source: Bureau of Labor Statistics, TradeStation
Everything else is on the grid.
Economic Calendar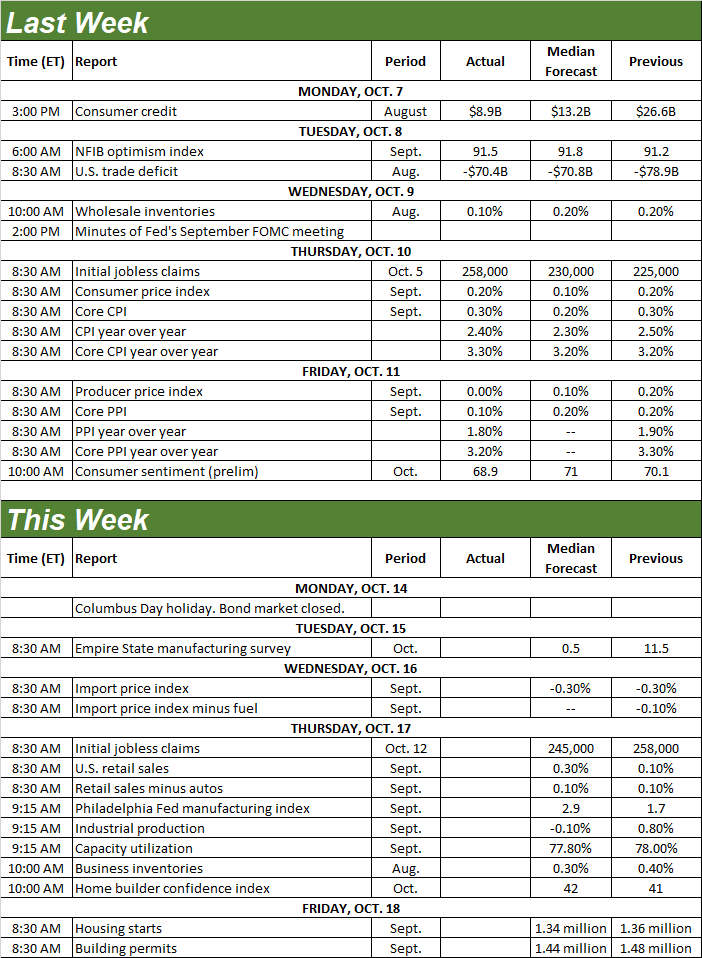
Source: Briefing.com
This week will be a little busier, but only a little, and nothing really gets going until Thursday. That’s when we’ll hear about last month’s retail spending, along with September’s industrial productivity and capacity utilization data.
Retail spending has been inching higher, but just barely. Economists are calling for another reasonably healthy advance, which is likely given other recent data.
Retail Sales Charts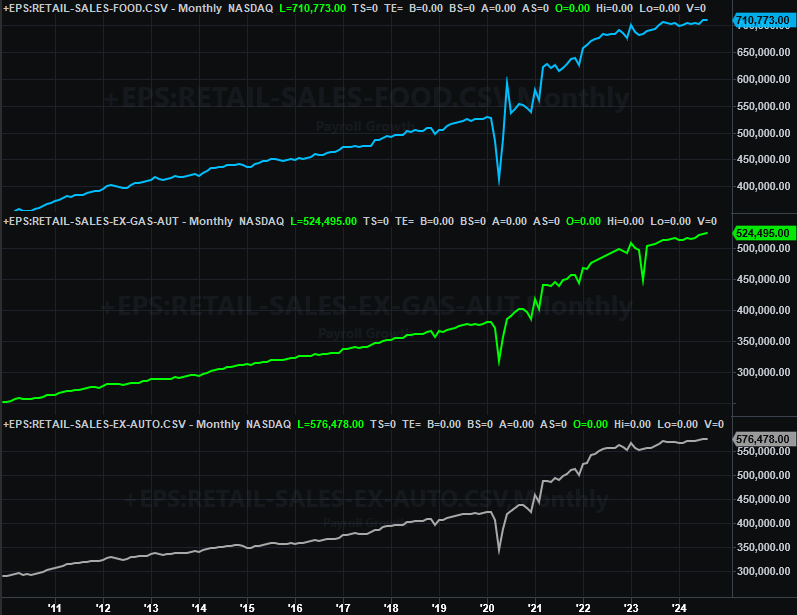
Source: U.S. Census Bureau, TradeStation
Industrial output and usage of the nation’s production capacity lurched a little higher in August, but forecasts suggest that was a one-off. These numbers will likely slide a little lower again this time around.
Capacity Utilization, Industrial Productivity Charts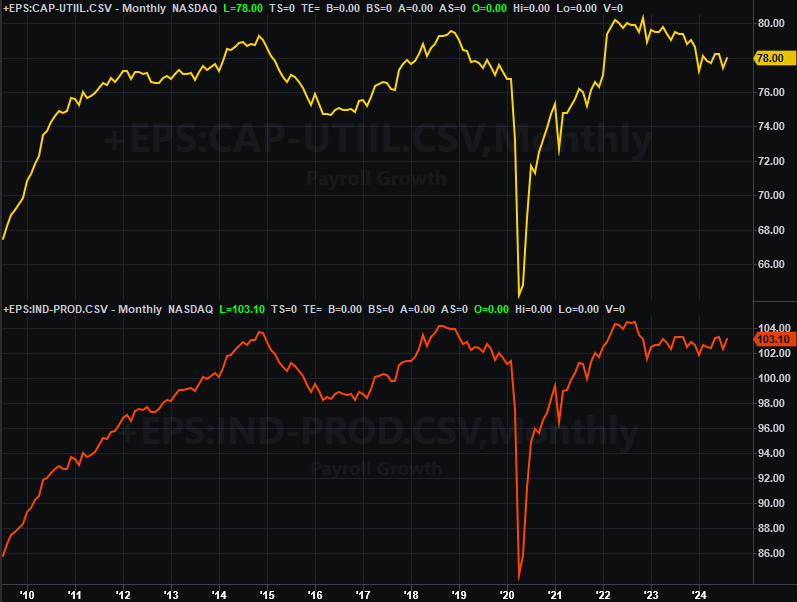
Source: Federal Reserve, TradeStation
One monthly lull isn’t a disaster. But, this utilization and industrial production data is clearly less-than-impressive. Given that corporate earnings tend to ebb and flow in the same direction as these numbers, which ultimately steers the market. This is part of the reason we’re still so adamant that stocks are vulnerable… at least to a correction.
On Friday we’ll get last month’s housing starts and building permits. Forecasts suggests September’s data will be more or less in line with August’s numbers, which ticked measurably higher from July’s levels. Even so, these numbers remain subpar. New homes may simply be priced beyond most would-be homebuyers’ reach right now. (Sales of new homes are also still below average, while sales of existing homes remains near multi-year lows.)
Housing Starts, Building Permits Charts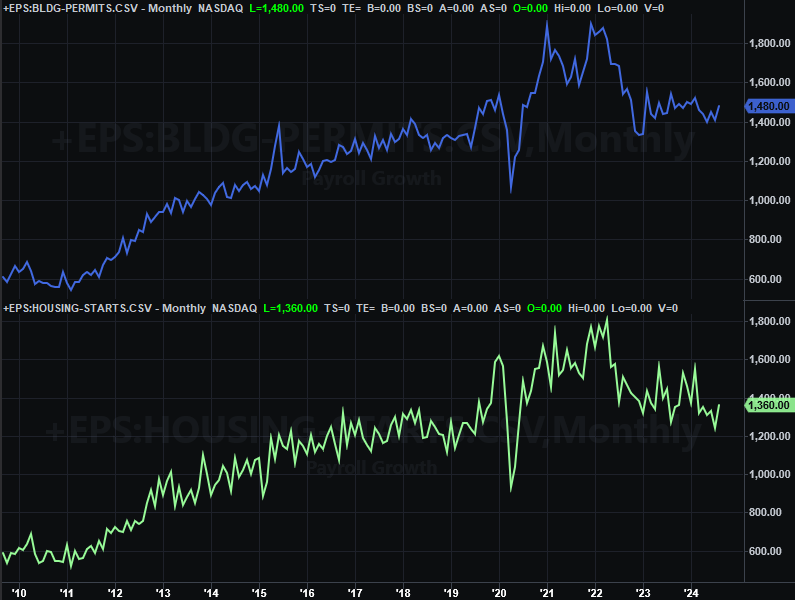
Source: U.S. Census Bureau, TradeStation
Also notice we’ll be getting October’s homebuilder confidence report on Thursday, which may (or may not) shed some light on what’s actually happening on this front. Just bear in mind this sentiment indicator could be (or again, may not be) skewed by the devastation following two major hurricanes.
Stock Market Index Analysis
As has been the case for some time now, stocks made more gains last week. As has also been the case for some time though, they did so on tepid volume. In fact, the volume behind the market’s gains continues to fade. Investors are simply growing less and less confident as the market advances that more gains are in the cards. (It sounds ironic on the surface, but it’s actually not uncommon for stocks to climb a wall of worry. What’s odd is that the market’s been able to make progress for as long as it has while volume wanes.) And the new noteworthy nuance? There seems to be a short-term technical resistance line (red, dashed) connecting all the peaks since mid-August.
S&P 500 Daily Chart, with VIX and Volume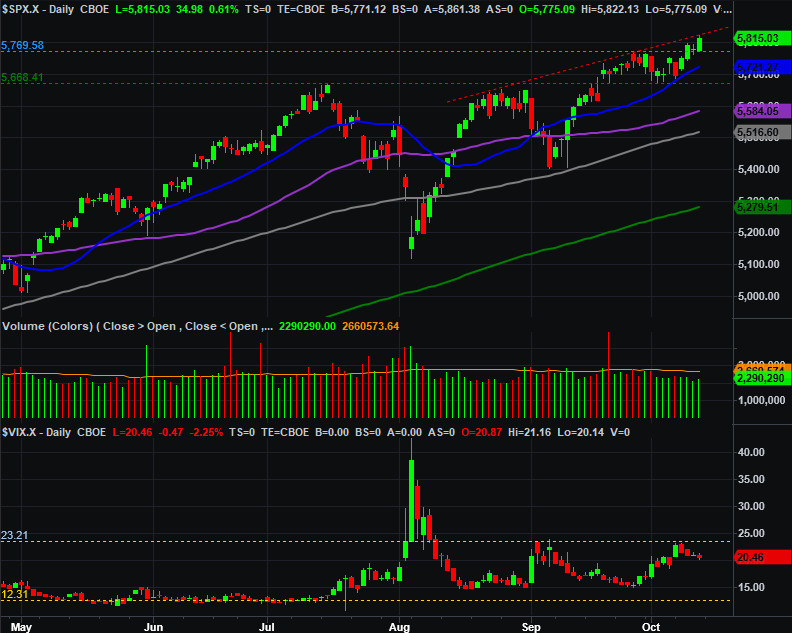
Source: TradeNavigator
Still, the break above the tentative ceiling around 5,770 (light blue, dashed) is telling. Also notice the S&P 500’s volatility index (VIX) is peeling back from a ceiling at 23 (gray, dashed), working in the bulls’ favor.
The NASDAQ Composite’s daily chart looks similar, although not identical. It’s poking at the recent high around 18,300 (white, dashed) where the index peaked last month, but didn’t actually clear it. It’s also obviously not under its record high of 18,657 reached in July.
NASDAQ Composite Daily Chart, with VXN and Volume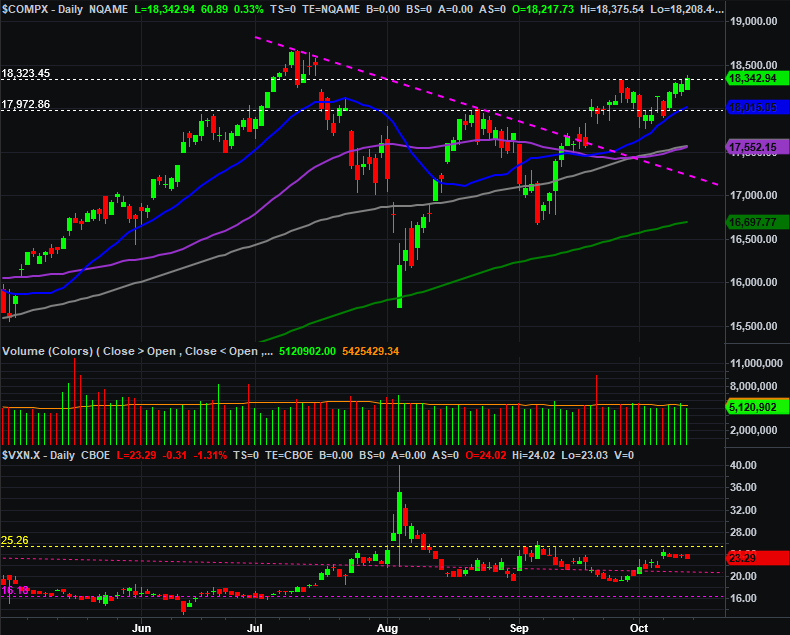
Source: TradeNavigator
Nevertheless, the general shape of the NASDAQ Composite’s chart since early this year is bullish. We’re seeing higher highs and higher lows since August, “rocking” the index upward. If it continues to do this, it will eventually squeeze itself out of this narrowing trading range, thrusting it sharply higher. (That’s the theory, anyway.) This is even more evident on the weekly chart, where we just saw a bullish MACD crossover.
NASDAQ Composite Weekly Chart, with VIX and MACD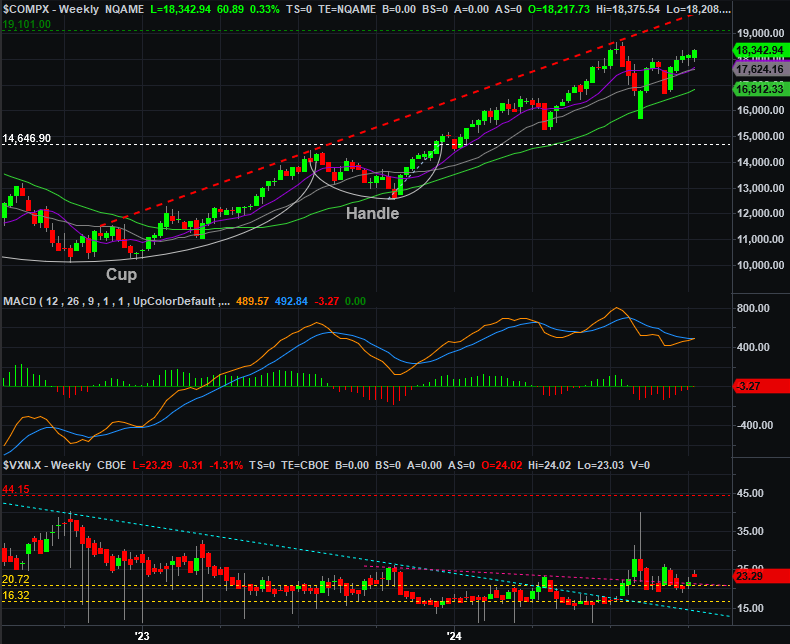
Source: TradeNavigator
As was already noted above, the weekly chart of the S&P 500 below isn’t facing the same problem. It hit yet-another record high last week, putting the previous technical ceiling at 5,656 a little further in the rearview mirror. Perhaps the most interesting feature on this chart, however, is still the way the S&P 500’s Volatility Index (VIX) continues to test its ceiling near 23 without ever actually hurdling it. Traders may be net-buyers, but they’re not fully committed to their bullishness. The VIX’s action suggests they’re hedging a bit.
S&P 500 Weekly Chart, with VIX and MACD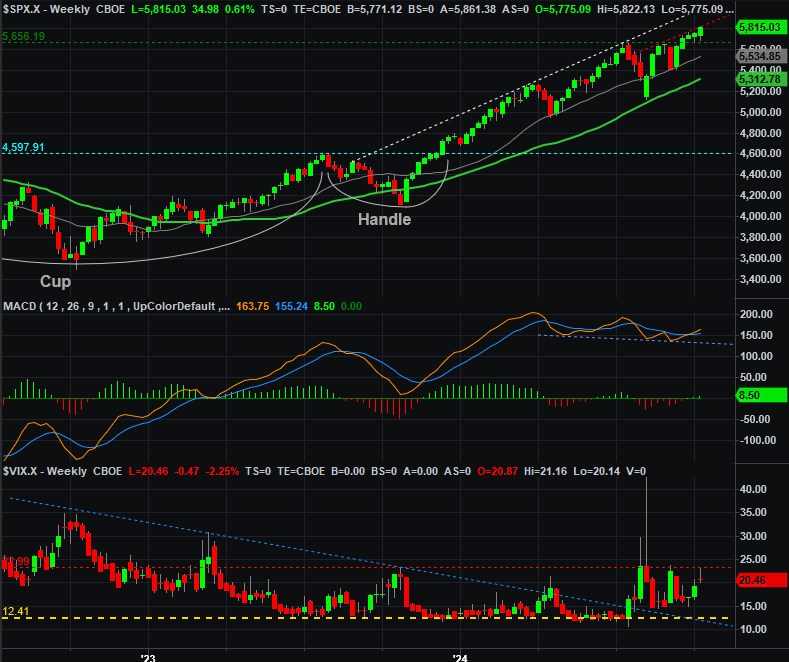
Source: TradeNavigator
So what’s the call? As we’ve said already, the trend is your friend. Even if this rally’s foundation isn’t exactly rock-solid. It’s still moving higher. There’s also still room to keep running before either index bumps into their long-term technical ceilings connecting all their major peaks going back several months. (That’s the red dashed line on the NASDAQ’s weekly chart, and the white dashed line on the weekly chart of the S&P 500.) We’re also headed into the time of year that’s usually bullish.
The only problem is, the year-end rally that typically starts in mid-October is usual starting following a sizeable September correction. We don’t have that this time around. The already-stretched market is going to become even more stretched from here… assuming there’s no correction on the horizon.
Just be ready for all contingencies here. Also don’t overreact to a mere little bit of turbulence. There’s room for a stumble that won’t spark a more serious selloff. In both cases the indexes will at least need to break under their 100-day moving average lines (gray) before we can truly entertain the prospect of a full-blown correction being made.