Weekly Market Outlook – There’s Still a Fighting Chance
Despite ending the previous week with some bullish momentum – and within striking distance of new record highs – all of it was wrecked last week. Blame bad economic news, mostly, although stocks themselves proved to be strangely vulnerable to data that wasn’t exactly surprising. It looks like traders now believe no plausible rate cuts this month will be enough to prevent economic malaise from cementing itself into place.
Still, there’s one last bastion of hope for a rebound for both key indexes.
We’ll pinpoint these technical floors in a moment. Let’s first look at last week’s biggest economic news, which of course ended with an alarmingly ugly jobs report. The revision of July’s payroll growth figure was even more alarming.
Economic Data Analysis
Yes, Friday’s payroll growth numbers are last week’s big news, but first things first. We also heard from the Institute of Supply Management last week as well. Its manufacturing index was updated on Tuesday, while the services index was updated on Thursday. Both ticked a little higher last month, but only a little. It’s certainly not arguable that there’s any convincing economic strength evident in this data.
ISM Services, Manufacturing Index Charts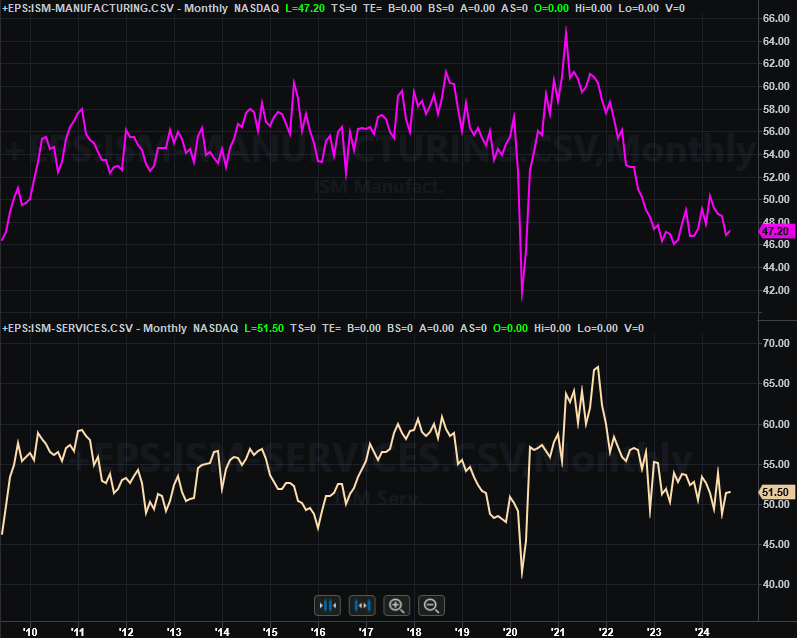
Source: Institute of Supply Management, TradeStation
In light of Thursday’s lackluster ADP employment report, it should be no real surprise that Friday’s data from the Department of Labor was a letdown. Rather than the expected 161,000 new jobs, the country only hired 142,000 people. Meanwhile, July’s payroll growth figure was dialed down from 114,000 to only 89,000. The unemployment rate still fell from 4.3% to 4.2%, as expected. That progress is mostly a mathematical one though. This is anything but a show of economic strength, upping the odds that we’ll see a 50-basis point interest rate cut when the Fed has a chance to make one on the 18th.
Unemployment Rate, Payroll Growth Charts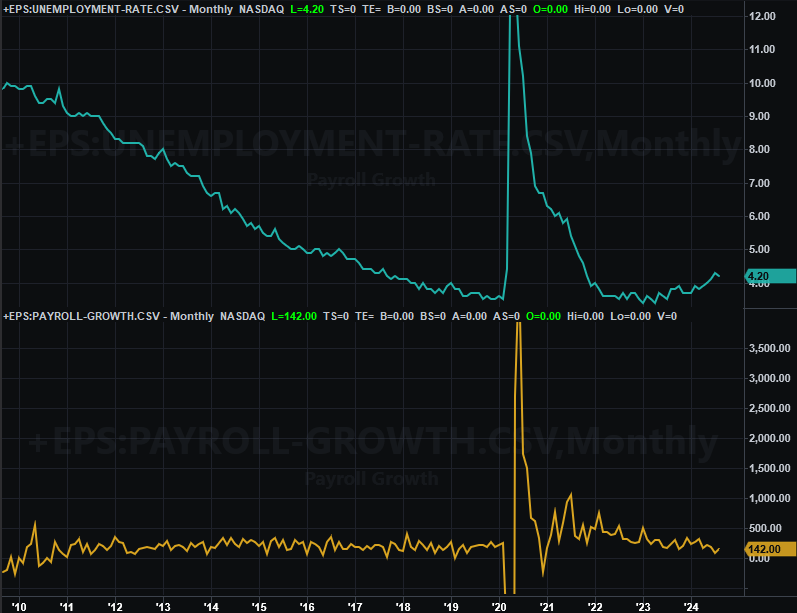
Source: Institute of Supply Management, TradeStation
Everything else is on the grid.
Economic Calendar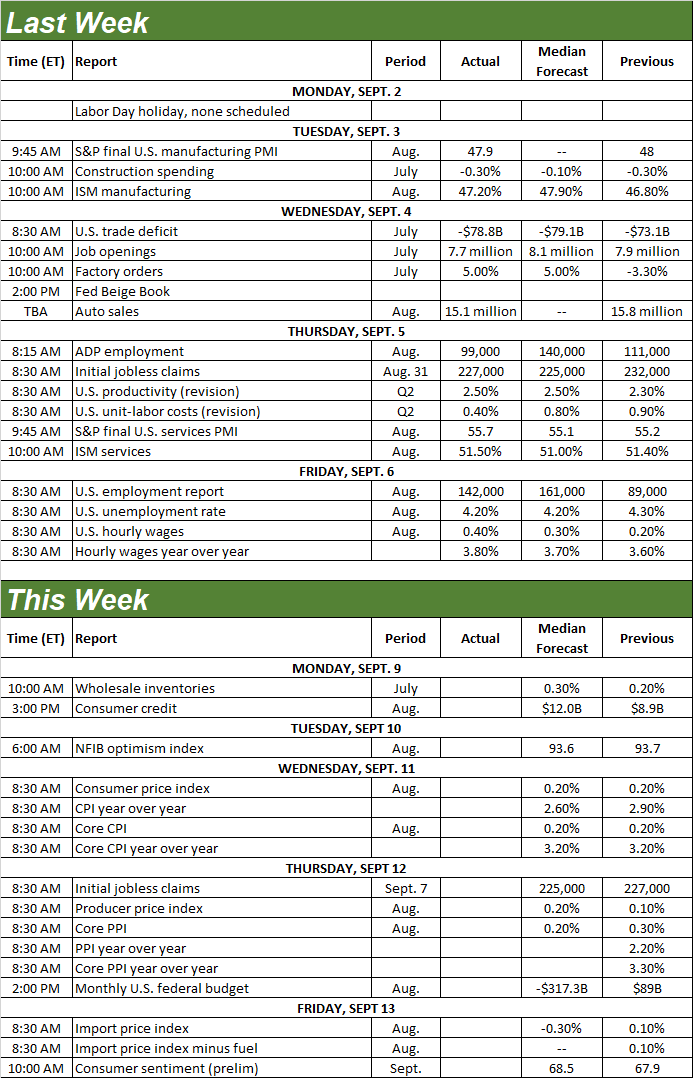
Source: Briefing.com
There’s not a lot in the cards for this week, but one of the rounds of updates we’re due are biggies… in the sense that it will impact the Federal Reserve’s interest rate decision. That’s inflation. August’s consumer inflation figures are due on Wednesday, with producer price changes coming on Thursday. All of them are down from 2022’s crazy levels, but all of them are also still above target. Don’t look for any meaningful changes this time around; inflation is still firm. Will it be seen as firm enough to give the Fed pause? Good question.
Consumer, Producer Inflation Rate Charts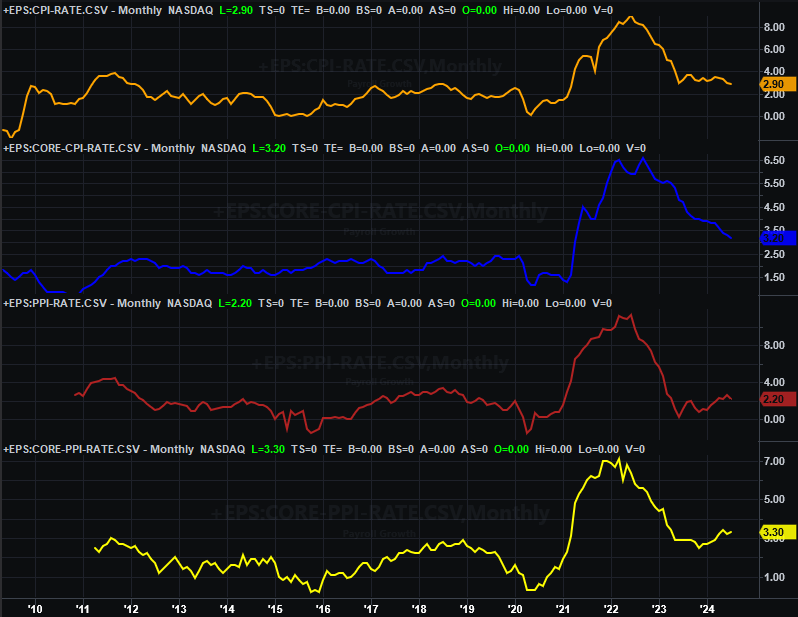
Source: Bureau of Labor Statistics, TradeStation
Stock Market Index Analysis
The market was within sight of a fully-rekindled rally. In just four trading days it all unraveled. Both the S&P 500 as well as the NASDAQ Composite fell under major support lines, and are nearing tests of others. The selling was so dramatic last week that we may see something of a dead-cat bounce effort take shape this week. Don’t be too quick to jump onboard though. The bulls will really need to prove their mettle before they’re trusted now. It is September, after all… a month that’s usually weak for the market, with that weakness usually lingering into the first part of October.
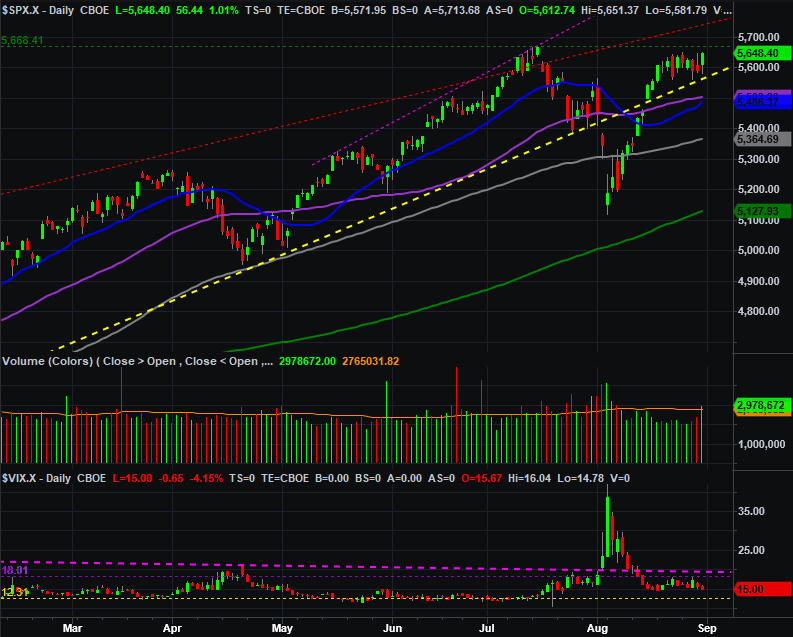
Let’s start with a daily chart of the S&P 500. As you can see, Friday of two weeks ago it was within striking distance of a new record above 5,668 (green, dashed). It was only a headfake. Four trading days late -- markets were closed for Labor Day – the index was back under long-term straight-line support (yellow, dashed) and back under its 20-day (blue) and 50-day (purple) moving average lines. The 100-day moving average line (gray) at 5,382 could easily be broken as a floor as well. The speed and ease with which it happened is as concerning as the fact that it happened at all.
S&P 500 Daily Chart, with VIX and Volume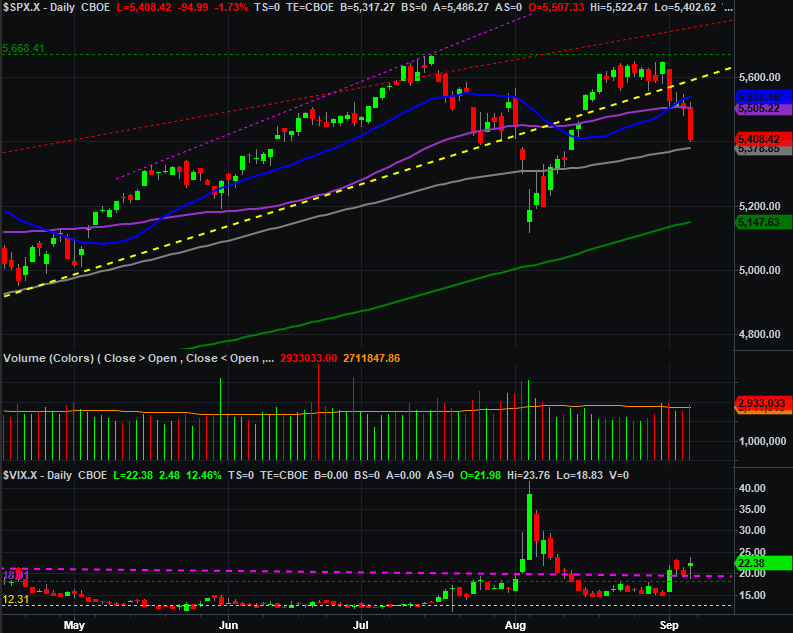
Source: TradeNavigator
There’s something else to draw out on the daily chart of the S&P 500, however, that in some regards is even more alarming. That’s the volatility index (or VIX) at the bottom of the chart. Given the scope and speed of the selloff, one would have expected the VIX to surge in the midst of the panicked selling. The fact that the VIX didn’t surge but only inched its way higher suggests the selling wasn’t panicked, but measured and thought-out. Modestly rising (but not wildly rising) volume implies the same.
It’s a potential problem simply because bottoms aren’t usually formed until real panic materializes and selling volume soars. In other words, there’s a decent argument to be made that more downside is in store.
Here’s the weekly chart of the S&P 500 to help put last week’s action in perspective. There’s nothing newly-revealed from this vantage point, but this picture does make clear that the bigger picture – the market’s overall undertow – has shifted for the worse since last month. Not only is the S&P 500 obviously struggling to make higher highs, it’s breaking established support levels at the same time the VIX is starting to make higher highs and higher lows. The bullish “framing” that was in place prior to August are no longer doing the job. Heck, even the MACD lines are as low a they’ve been since early this year… when they were on the way up.
S&P 500 Weekly Chart, with VIX and MACD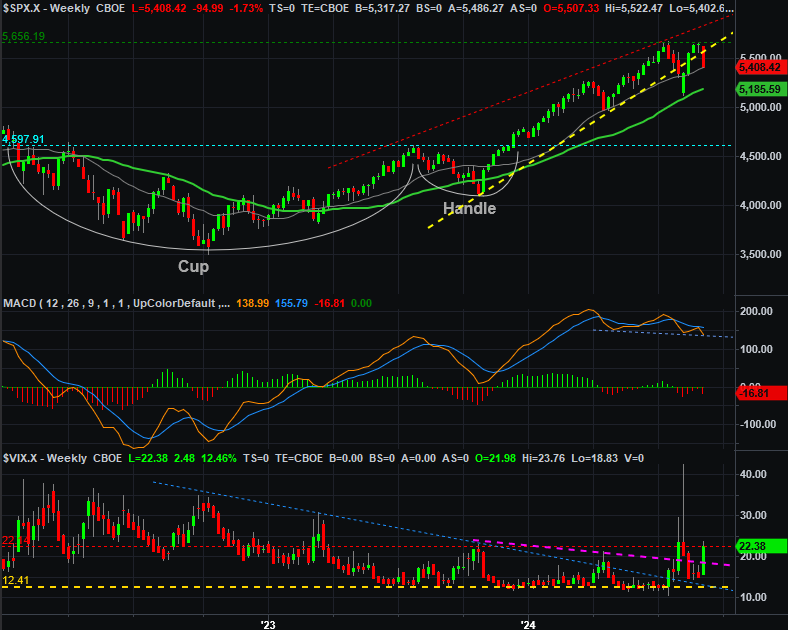
Source: TradeNavigator
The exact same thing can be said of the NASDAQ Composite, but with one key difference. That is, the NASDAQ has suffered far more technical damage over the past couple of weeks than the S&P 500 has, and is now within sight of its 200-day moving average line (green) at 16,415. There’s no other technical support in sight other than that line.
NASDAQ Composite Weekly Chart, with VXN and MACD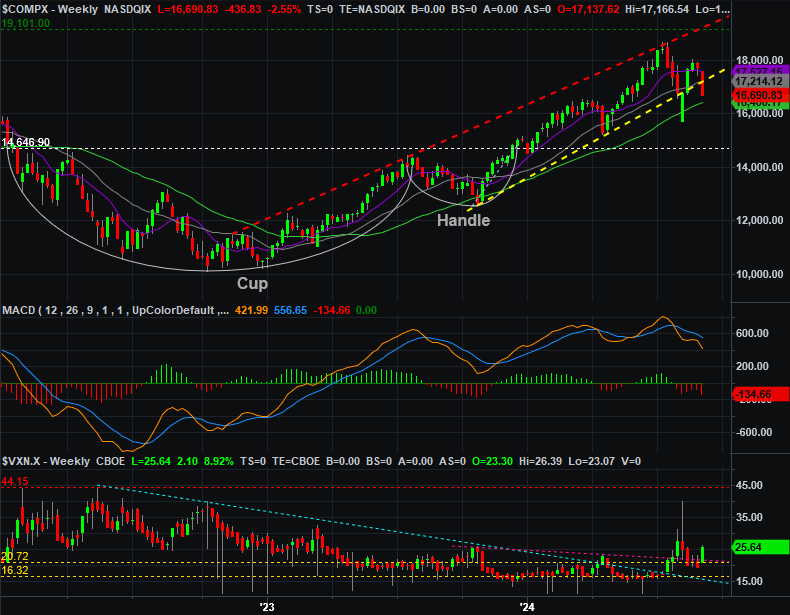
Source: TradeNavigator
Also notice that the composite’s MACD lines on the weekly chart are decidedly bearish, yet the NASDAQ’s volatility index has plenty of room to keep rising (now that it is rising). That means there’s room for the NASDAQ Composite itself to continue falling.
But the prospect of lower interest rates is bullish? That’s the rhetoric to be sure. Don’t be too quick to assume the market’s going to behave as it’s “supposed to” though. Traders often anticipate what they think might be coming, and if the Fed is lowering rates, it’s doing so because the economy is weak -- not strong.
More to the point, although we might see some initial strength in the form of a bounceback from last week’s 4.2% rout, it’s going to take a serious effort to undo last week’s damage and put stocks back above the bulk of their technical floors.
But, maybe.