Surprisingly, there is not much publicly available data on what are the most popular chart types and technical indicators used by traders worldwide. The book New Frontiers in Technical Analysis by Paul Ciana is one of the first to attempt to frame some of this information in a quantitative fashion.
Why is this information useful? Well, knowing what indicators are most-used (or even over-used) can give an individual an edge in terms of possibly anticipating technically-driven price moves. Or one could shy away from these and try to find new ways of analyzing charts and price/volume/trend movement.
In the book, Ciara uses a sample of market participants from 2005 to 2010 who used the Bloomberg Professional Service. 44% were North America based, 38% Europe, 12% Asia, 2% Middle East & Africa.
About half of the traders use Line Charts:
2009 saw a spike in the use of log-scale charts, which the author attributes to the large volatility experienced during that time. Not surprising, Asia has a much higher usage of Candle charts (Candlestick) than does Europe or America ... 43% in Asia used Candlestick charts.
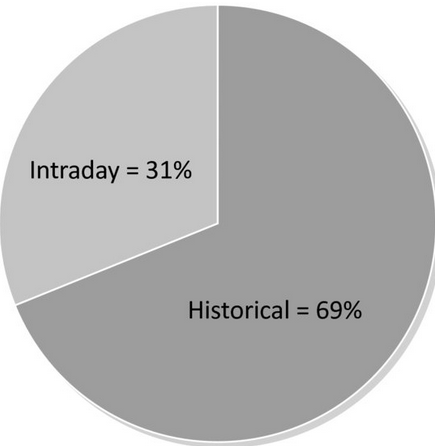
He also looked at the data of traders who use intraday vs daily (or longer) "historical" charts:
So about 70% of traders do not use intra-day charts, but Ciana notes that there was a rise in their usage in the time period examined (2005 to 2010) -- he theorizes that market participants choose intraday charts more frequently in bear markets than in bull ones.
As far as technical indicators themselves, the author advises to select half a dozen studies and dig deeper into the calculations and tendencies of various technical indicators. He also recommends to choose a variety of indicators to analyze with different objectives, such as Smoothing (MACD), Momentum (RSI) and Distribution (Bollinger Bands).
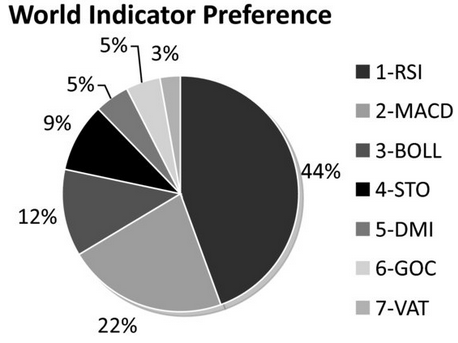
Ignoring the Simple Moving Average (SMA), which is likely the most popular indcator, Ciana's data shows the most-preferred technical indicators:
Relative Strength Index (RSI)
Moving Average Convergence/Divergence (MACD)
Bollinger Bands (BOLL)
Stochastics (STO)
Directional Movement Index (DMI)
Ichimoku (GOC)
Volume at Time (VAT)
The author's analysis is that the preference for RSI, VAT, and BOLL showed the most growth during the time period.
As we mentioned, knowing what other traders are utilizing is useful information for your own trading development. Also note that some of our BigTrends unique approaches such as modified Percent R, CCI, Efficiency Ratio, and Acceleration Bands haven't come close to reaching saturation status. This give them more of an "edge" in our view, since less people are focusing on these great indicators.
For more about BigTrends in-depth technical analysis education products, please call 1-800-244-8736.


