Speaking Of Big Trends, We Are Nearly 1 Year Into The Rally From Last November - Weekly Market Outlook
Speaking Of Big Trends, We Are Nearly 1 Year Into The Rally From Last November - Weekly Market Outlook
SPX Is Up 31% From November 2012 Low
Despite the overbought condition the market started out in at the beginning of last week, stocks still managed to eke out a small gain over the prior five trading days. It was a minor gain, and a struggle all the way up. But, a gain is a gain, and the trend is your friend.... usually. While the bulls have the edge because they have the momentum, there's still something uneasy about how far the rally's come here.
We'll look at all the potential stumbling blocks this rally will be facing this week in a moment. First, let's catch up with some of the economic numbers that have been on hold thanks to the government shutdown.
Economic Calendar
As expected, we got a pretty big dose of all that backed-up economic data last week. There's too much to detail all of if, but we will hit the highlights, beginning with what was undoubtedly the most-awaited set of overdue data - last month's employment snapshot.
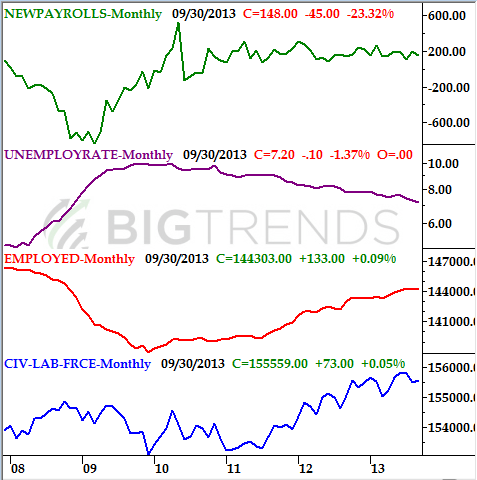
Overall, the jobs situation got measurably stronger in September. Yes, the unemployment rate edged down from 7.3% to 7.2%, but that wasn't even the most compelling piece of jobs-related data. Nor are the 148,000 jobs added last month. It's the fact that the number of employed people went up, from 144.17 million to 144.303 million, and the number of unemployed people (who are actually in the labor force) fell, from 11.316 million to 11.255 million. Even the number of people who aren't counted in the labor force but still want a job (and don't have one) fell by about 120,000 last month. It's the first time in a long time every piece of data actually made progress, suggesting the rebound is getting real traction.
Employment Chart
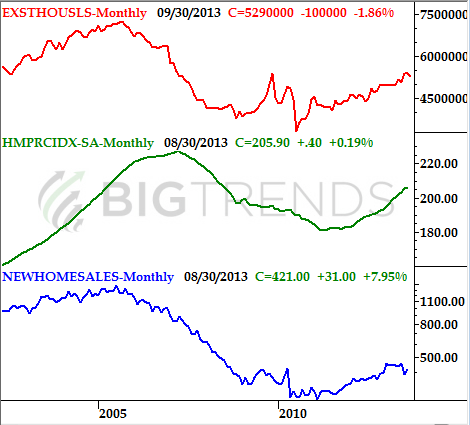
The other major data-dump last week came on the real-estate and housing front. Existing home sales fell from a pace of 5.39 million to 5.29 million, but that's still a solid number compared to the recent long-term norm. Home prices for August also ratcheted up, once again hitting multi-year highs.
What's still missing from the picture is the new-home sales figure for September, which was expected on Thursday (a forecasted reading of 432,000 units), but has yet to be posted. Still, we know enough about the current state of real estate to say it's still relatively healthy.
Real Estate/Housing Chart
Economic Calendar
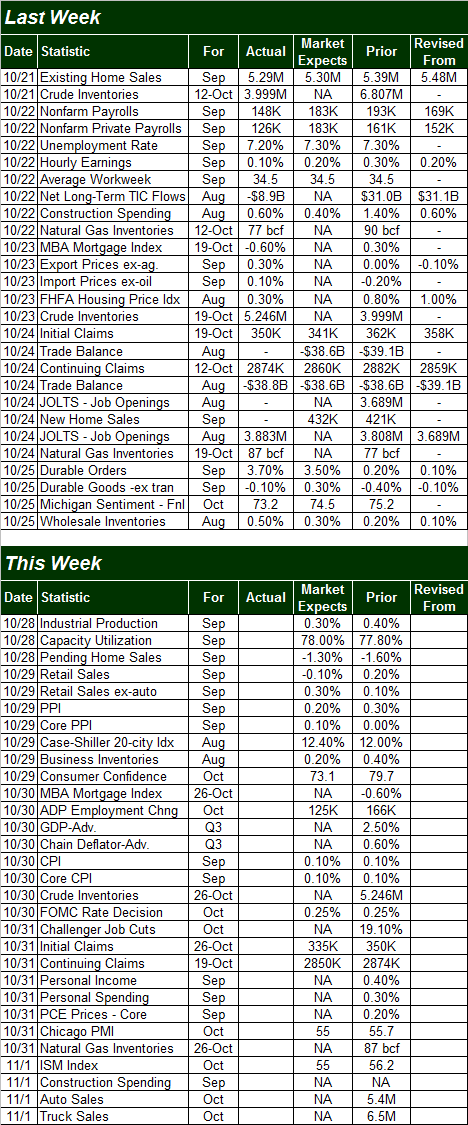
Like last week, don't be shocked if something that's scheduled for release this week doesn't actually come out. But, it looks like most things are on track.
Monday's capacity utilization and industrial productivity (from the Fed) should be out on Monday, retail sales for September will be issued Tuesday - along with producer inflation - with consumer inflation information due Wednesday. All of these data sets are expected to show modestly-healthy changes.
The October jobs report was originally scheduled for Friday, November 1st, but has been pushed back to Nov. 8th. ADP and Challenger will still both post their jobs report on Wednesday though.
Stock Market Index Analysis
There's no other way to describe the market's current situation ... momentum is in the midst of a head-on collision with being realistic. Last week, the S&P 500 advanced 0.87%, logging a third straight week of gains, and extending the bigger-picture rally (from late August) to 7.7%. It's not unheard of, but it is unusual. In fact, the last major correction we've had was in November of 2012, and that was only an 8.6% slide. And since then, the S&P 500 (SPX) (SPY) has gained 31%. Point being, to make any gain here at all is bordering on "unbelievable". Yet, there it is - the S&P 500 is inching into new-high territory.
What's next? Though it's an uncomfortable idea, until the uptrend is clearly broken, the right move is to side with the rally. What's interesting about that idea, however, is that it's not as technically crazy as it may seem on the surface.
As you can see on the daily chart of the S&P 500 below, rather than getting pushed back - lower - by a bump into the upper 50-day Bollinger band (orange) late in the week two weeks ago, the SPX simply continued to trade a tad above it, almost using it as a guidepost. As recent history has shown, the upper 50-day Bollinger band has been the bears' best reason to push stocks lower again. The fact that they couldn't do it this time may be a huge bullish clue.
S&P 500 & VIX - Daily Chart
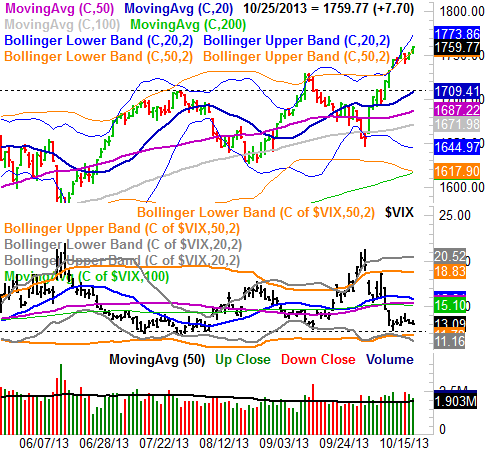
It's also worth noting that the upper 20-day Bollinger band (blue) is in no position to halt the bullish advance. And, though the CBOE Volatility Index (VIX) (VXX) is near an extreme low reading, it's not at an absolute floor yet. It all implies more bullishness could be ahead, as unlikely as it may seem.
Not a lot really changes when you zoom out to a weekly chart of the S&P 500 - the tepid rally is still going reasonably strong, and still has room to keep moving before bumping into the ceiling at the upper 52-week Bollinger band. And, considering that ceiling continues to edge upward, the SPX may not bump into it for weeks. It certainly makes sense. We're in one of the most bullish calendar periods of the year traditionally, and the market may be intent on making that rally happen, even if it's not necessarily the wisest decision to do so right now.
SPX & VIX - Weekly Chart
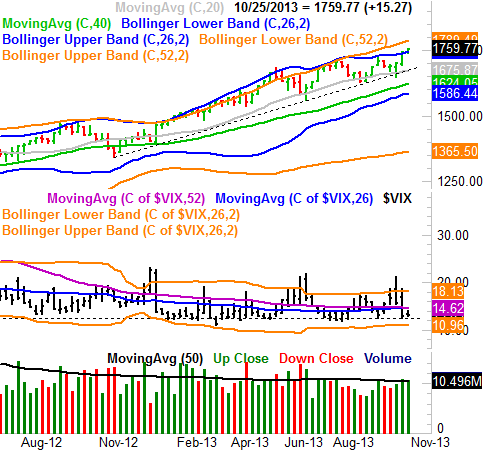
Something else that shows up on the weekly chart that doesn't show up on the daily chart (which favors the bulls) is the fact that the volume over the past three weeks of gains has been higher than the recent average, and growing. It's not huge, but it does say the participation needed to make this rally last is materializing.
So we're bullish? Technically speaking, we have to be, though with a massive caveat. ... the market of late has been about speculation and opinion rather than value and future prospects. This rally could stop and turn on a dime, with no warning, even if the chart of the S&P 500's chart looks bullish.
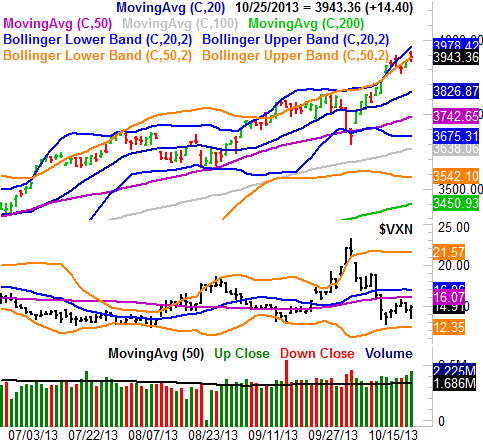
For a glimpse of just how close the market is to a reversal, one doesn't have to look any further than a chart of the NASDAQ Composite (COMP) (QQQ), which hinted at a reversal with Friday's action. The bullish open for the NASDAQ Composite was reeled in quite a bit, and the NASDAQ's volatility index - the (VXN) - was working hard to move higher that same day. The combination of the two clues suggests the bears are testing the waters here. Point being, remain nimble here.
NASDAQ Composite & VXN - Daily Chart
Should the market pull back, the S&P 500 has a huge technical floor at 1676, where a long-term support line (dashed) as well as the 100-day moving average line (gray) are resting. We'd use that as our first downside target should a selloff take shape.
Trade Well,
Price Headley
BigTrends.com
1-800-244-8736
