Where We Stand Now - Weekly Market Outlook
Despite Wednesday's heroically bullish day, Monday's and Friday's tumbles were enough to translate into about a breakeven for last week... against a (mostly) bearish backdrop. That is, although the S&P 500 (SPX) (SPY) made a very modest gain last week, it made even bigger losses in each of the prior two weeks, and is still knocking on the door of some very critical support levels.
We'll have a detailed discussion of those support lines below, after a close examination of last week's and this week's key economic numbers.
Economic Data
It wasn't a terribly busy week last week in terms of economic news, but we did get a couple of interesting data nuggets.
Perhaps above all else, retail sales grew nicely. They were up 1.2% overall in May, and they grew by 1.0% when taking automobile sales out of the equation.
Retail Sales Chart
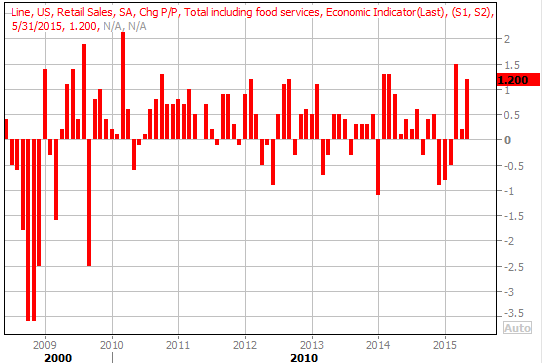
Source: Thomas Reuters
The only other truly noteworthy economic data we heard last week was May's producer price inflation. Though still tepid on an annualized basis (on a core as well as a non-core basis), May's 0.5% uptick was a nice little bump. On the other hand, not counting the cost of food and fuel, producer input costs were only up 0.1%.
Producer Price Inflation Chart
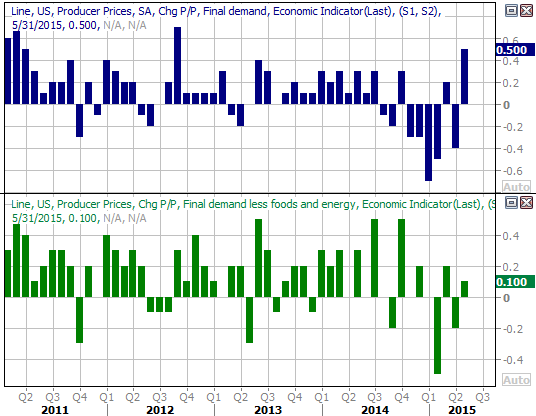
Source: Thomas Reuters
While still on the low side of the desired range of readings, we can see a little improvement on the inflation front. This week's consumer inflation figure will be an important indication [more important than producer inflation anyway] of the true inflation picture the Fed is looking at to judge if or when interest rates need to start moving higher.
Everything else is on the following grid:
Economic Calendar
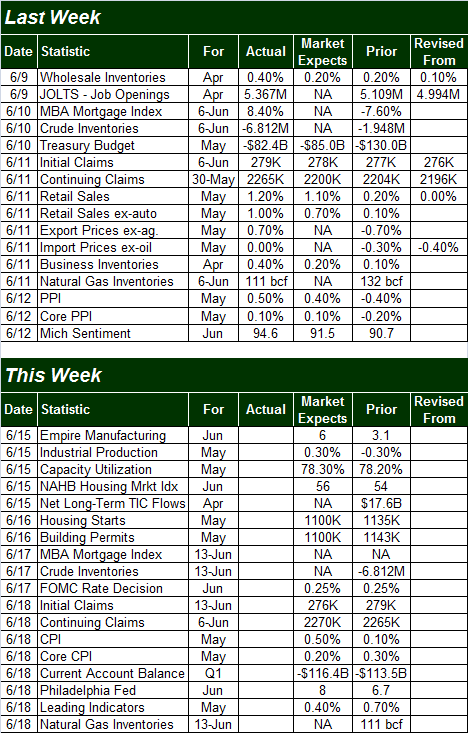
Source: Briefing.com
Aside from May's consumer inflation data due on Thursday, we'll also be hearing about May's industrial production and capacity utilization on Monday, and we'll get last month's housing starts and building permits on Tuesday.
You may recall starts and permits surged in April following an alarming lull in March. While we'd love to see another month of forward progress from both data sets, bear in mind April's strong numbers are going to be a tough act to follow.
Housing Starts and Building Permits Chart
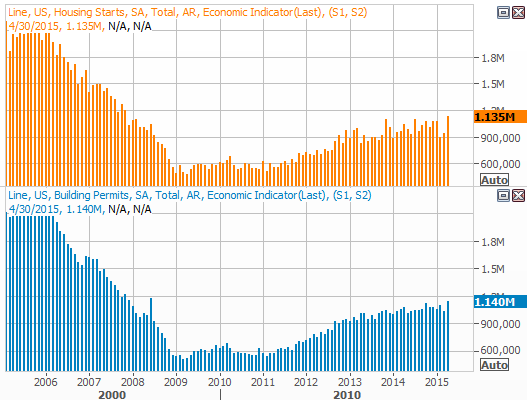
Source: Thomas Reuters
Stock Market Index Analysis
In retrospect, the fact that the market's selloff got a temporary reprieve last week comes as no surprise. As you'll see on the daily chart of the S&P 500 below, the lower 20-day Bollinger band was reached again, and just like the last time it was tested, it ended up acting as a floor. You can also see Tuesday's low of 2072.14 was where the index found a floor in early May and mid-April. Clearly there's something at least semi-significant about that mark.
S&P 500 & VIX Daily Chart
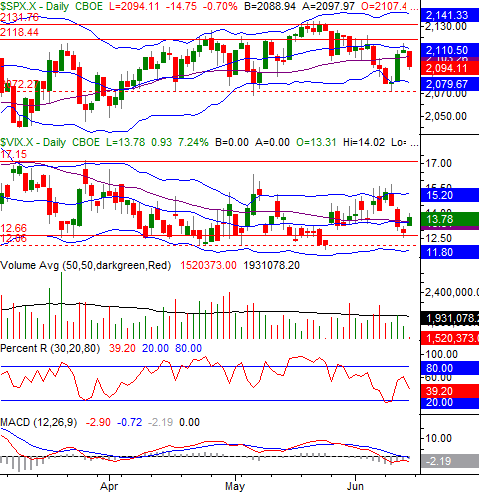
Chart created with TradeStation
All the same, the fact that the S&P 500 finished last week the same way it started it (on a bearish foot) after failing to hurdle the 20-day moving average line (blue) at 2111 on Thursday speaks volumes about the current lack of bullish conviction at this time.
That weakness is underscored by the MACD and Percent R lines.
While the Percent R line isn't below the "red alert" level of 20.0, it was below that level on Tuesday, and it's pointed that way again. Remember, a downtrend is confirmed when the Percent R line falls below 20, rises without going back above 20, and then starts to move downward again.
As for the MACD lines, not only do we have a bearish divergence now, both MACD lines are now under the key zero level. The one thing worse would be a new bearish divergence (crossunder) that occurred below the zero level, but what we have at this time is enough trouble as is. And yet...
The one missing ingredient - and reason for bullish hope - on the daily chart of the S&P 500 is the fact that the index has yet to actually make a lower major low. It will need to move below the aforementioned floor around 2072 to really start the selling avalanche. Until then, there's enough of a chance of a rebound that the best place to be right now is on the sidelines, watching it all unfurl.
The bearish argument doesn't get any better when we zoom out to a weekly chart of the S&P 500. It's in this timeframe we can see the 26-week moving average line at 2081.7 is still acting as a floor, as it has since March. We can also see the CBOE Volatility Index (VIX) (VXX) seems to be capped by a couple of its moving averages despite starting a decent upside move four weeks ago.
S&P 500 & VIX Weekly Chart
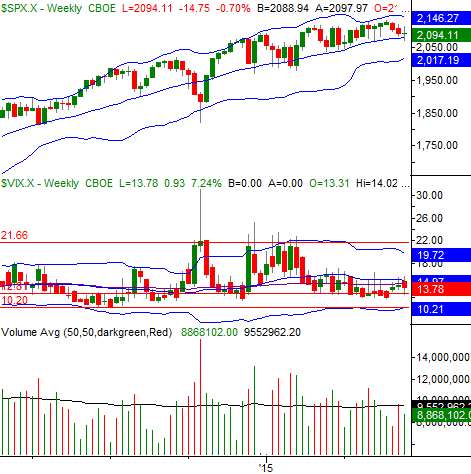
Chart created with TradeStation
For what it's worth, the NASDAQ Composite (COMP) is still holding above a key floor at 5021. Even though it too has a bearish MACD divergence in place, that support at 5021 really needs to step to signal a bigger pullback is finally in place.
NASDAQ Composite & VXN Daily Chart
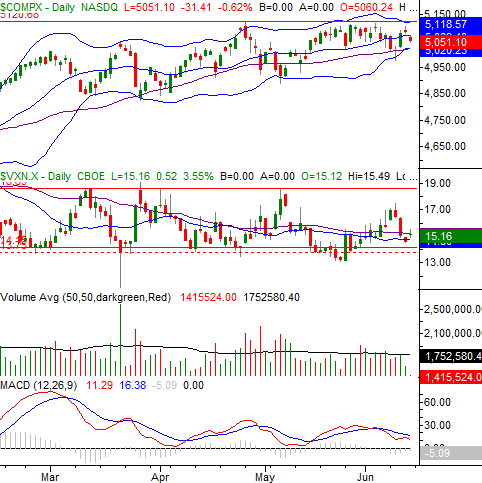
Chart created with TradeStation
The bottom line is, this week is going to be a critical "tell" for the market's true direction.
Industrial Sector Heating Up
Last year wasn't an especially fruitful one for industrial stocks like General Electric (GE) and 3M (MMM). This year to date hasn't exactly been a rip-roaring one either. But, the shape of the S&P 500 Industrials Sector Chart (XLI) has become compellingly bullish over the course of the past few months, with hints that this group is starting a rally.
Our graph below isn't complicated. After being held down under a ceiling at 763 for all of 2014, the S&P 500 hurdled that ceiling in March and never looked back. In fact, that former ceiling seems to have become a floor in the meantime, ending the April lull and setting up a rebound move over the course of the past two weeks. The 100-day moving average line (gray) appears to be the newest floor, pushing the stock upward since it was tested again in late April.
S&P Industrials Sector Chart
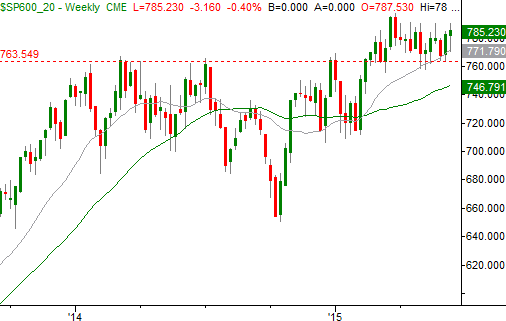
Chart created with TradeStation
Obviously a marketwide selloff would still act as a headwind for the industrial stocks if that's what's in store. If the market can simply manage to tread water (or better) though, the industrial sector may well end up becoming a surprising pocket of strength and leadership.
Trade Well,
Price Headley
BigTrends.com
1-800-244-8736