Weekly Market Outlook – That’s Not The Recovery Effort the Bulls Wanted to See

Yes, the market bounced back in a big way last week following its terrible open. All told, the S&P 500 finished Friday’s session 4.5% above Monday’s multi-week low, cracking a couple of noteworthy technical resistance lines as a result.
It’s far too soon for the bulls to be celebrating though. The bounce thus far is less than an ideal beginning of a recovery move. Indeed, so far it’s still possible it was merely a dead-cat bounce to reliever some of the pressure built up in the wake of the prior three weeks’ selling. It may be over now, ready to cede back to the bears.
We’ll show you why this is still a distinct possibility in a moment. Let’s first look at last week’s key economic reports and preview what’s coming this week. Spoiler alert: A couple of items in this week’s lineup could have serious implications for interest rates.
Economic Data Analysis
There was only one time of interest posted last week… the ISM Services Index update. It improved as expected, but more than expected. In fact, the move to 51.4 pushes the index well above the pivotal 50 mark. Even so, the bigger trend seems to remain to the downside, while the manufacturing index -- although below 50 again for July -- is actually trending higher.
ISM Index Charts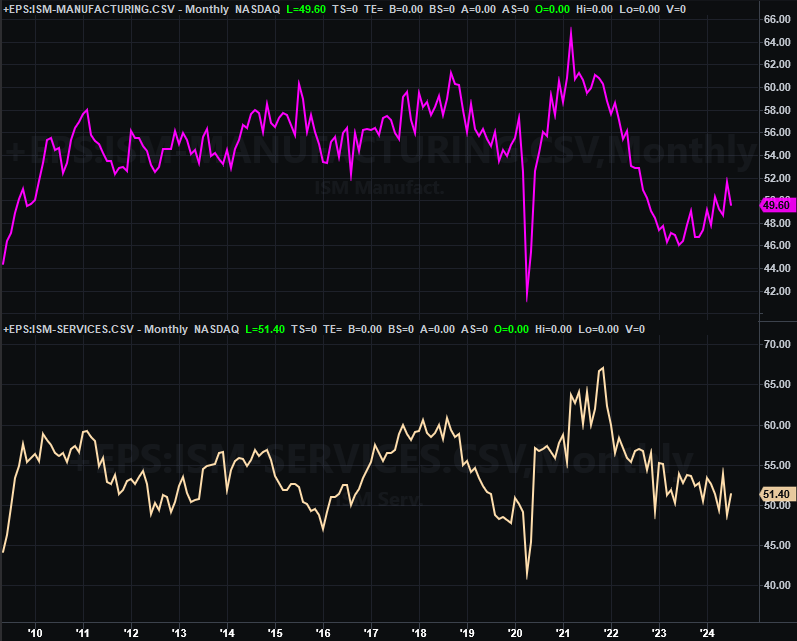
Source: Institute of Supply Management, TradeStation
Everything else is on the grid.
Economic Calendar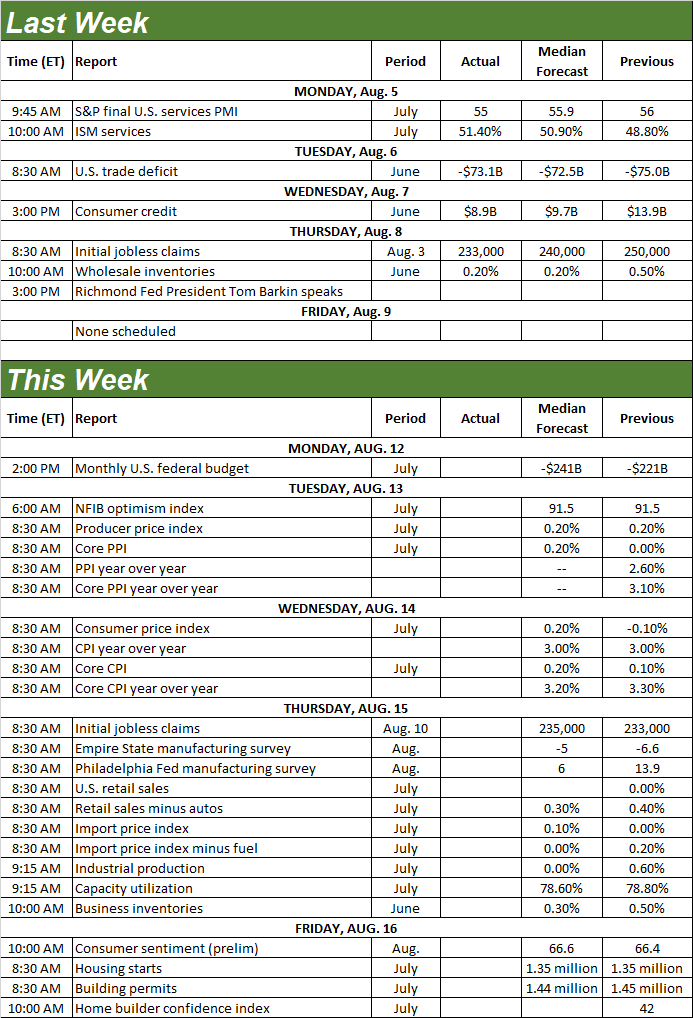
Source: Briefing.com
This week’s loaded. The party starts on Tuesday, with a look at last month’s producer inflation data. Producer’s costs have actually been inching higher since late last year, and will likely remain in that shallow uptrend this time around. Consumer inflation figures are due on Wednesday. Price growth on this front has been cooling, but remains relatively high… high enough for the Fed to feel compelled to become even more dovish when payroll growth is slowing and the unemployment rate is on the rise. Unfortunately, economists believe consumer inflation rates are going to hold steady at their recently-above-average levels (although that will embolden the Fed to act).
Consumer, Producer Inflation Rate Charts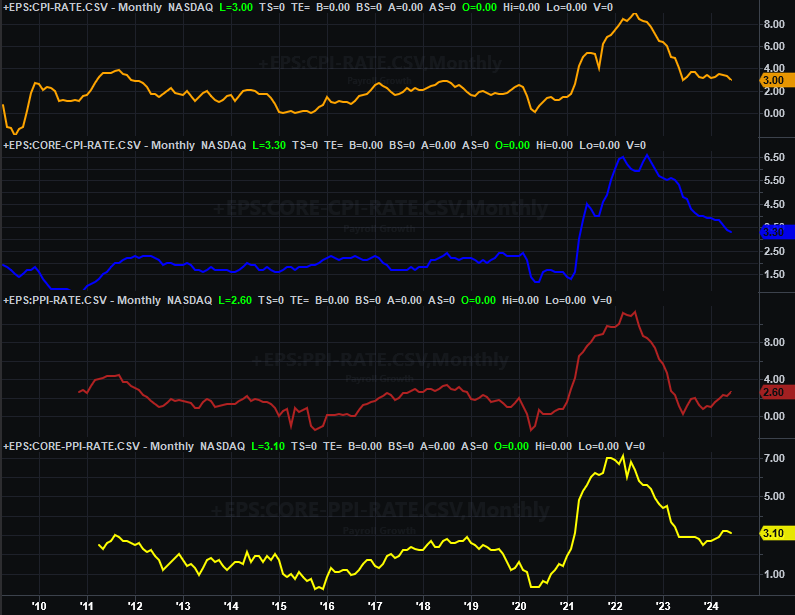
Source: Bureau of Labor Statistics, TradeStation
Look for July’s retail sales data on Thursday. Consumer spending has mostly continued to trend higher despite economic headwinds. We’ll likely see more of the same modest growth this time around in all stratifications of retail sales.
Retail Sales Charts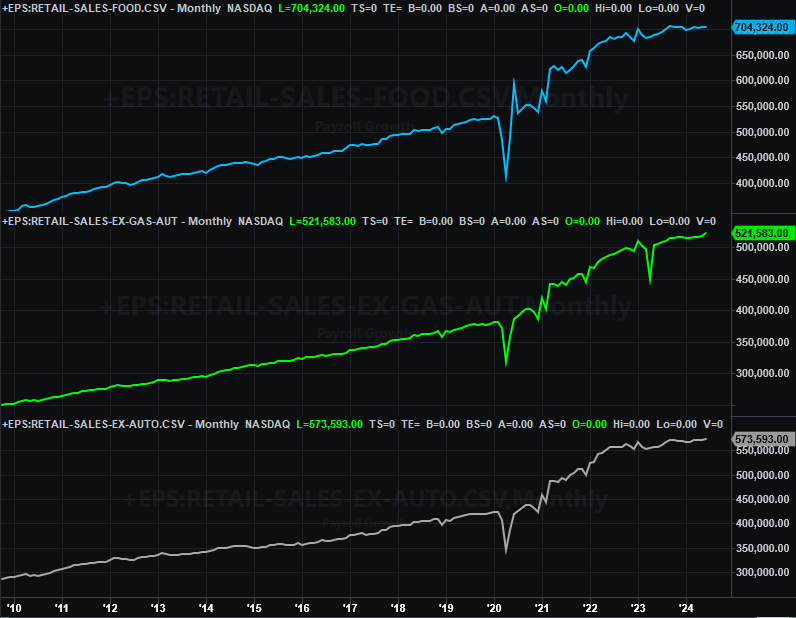
Source: Census Bureau, TradeStation
Also on Thursday we’ll hear about July’s industrial production and capacity utilization, from the Federal Reserve. These are actually telling numbers even if not often discussed. Both have also been trending higher since early this year too, suggesting economic growth that isn’t necessarily showing up in other ways. Forecasts are calling for a slight cooling on both fronts this week, although not enough of a slowdown to sweat just yet.
Industrial Production and Capacity Utilization Charts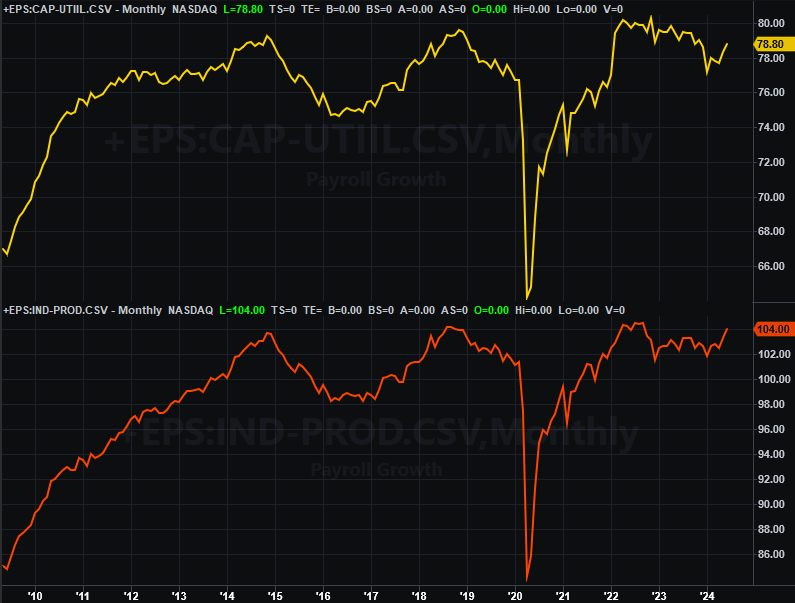
Source: Federal Reserve, TradeStation
Finally, on Friday we’ll get last month’s housing starts and building permits numbers. Both have been at pretty poor levels for a while now. That’s not expected to have changed in July. Yes, it’s confirmation that the real estate market is struggling (although there’s a lot more real estate data due next week that will better tell that story).
Housing Starts and Building Permits Charts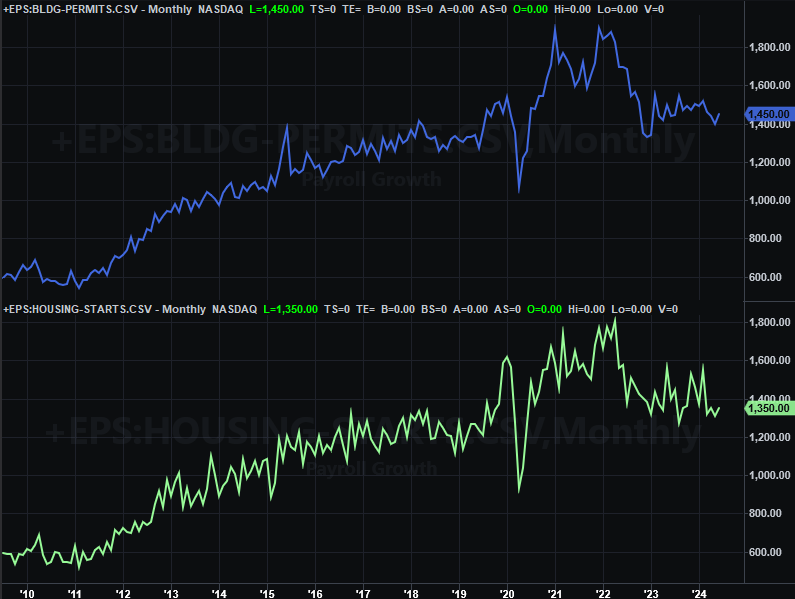
Source: Census Bureau, TradeStation
Stock Market Index Analysis
Sure, stocks bounced back from their huge setback early in the week. When all was said and done the S&P 500 ended last week 4.5% above Monday’s miserable low. It’s far too soon to say that was “the” bottom and stocks are rolling higher again. There’s still a very good chance it was nothing but a dead-cat bounce that will ultimately cede to the bigger-picture downtrend sooner than later.
Take a look. As the daily chart of the S&P 500 shows us (and as could have been expected once the VIX surged on Monday), the buyers plowed back in for the remainder or the week. The index even fought its way back above the 100-day moving average line (gray) at 5,313. Now take a closer look. The volume behind the move was fading all the way up. It wasn’t so much that buyers were scooping stocks up in droves. It may have simply been that sellers and bears just weren’t putting up any resistance. They may have let the bulls have this small victory, and are planning to take control again this week and re-drop the market from a slightly-higher high.
S&P 500 Daily Chart, with VIX and Volume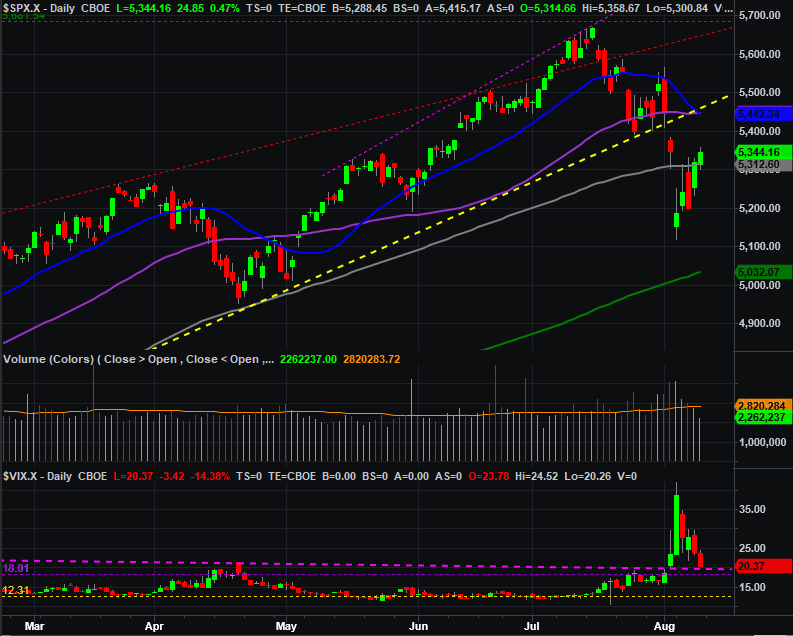
Source: TradeNavigator
Here’s the weekly chart of the S&P 500. While last week’s open-to-close gain is impressive, this chart also reminds us that the index didn’t actually make any meaningful net gain last week. Friday’s close of 5,344.16 is actually still down just a little from the prior week’s close. And, this same chart also reminds
S&P 500 Weekly Chart, with VIX and MACD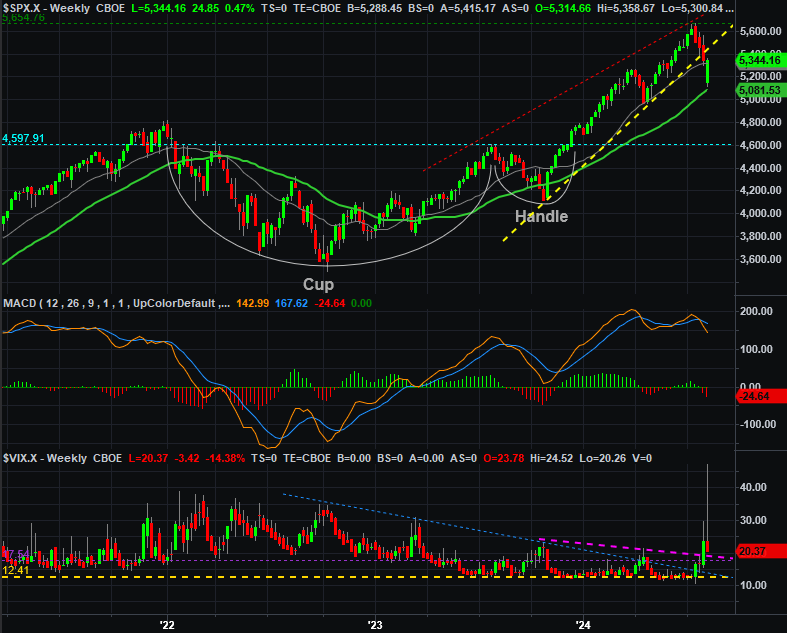
Source: TradeNavigator
Here’s the daily chart of the NASDAQ Composite. It looks similar to the S&P 500’s, but not identical. Namely, the composite started to slow down as it fought its way higher. It never ended up making its way back above the 100-day moving average line (gray), nor did it push its way back above the lower edge of the long-term trading range (dashed, yellow). And like the S&P 500, the volume behind the advance was never particularly strong, suggesting there’s not a whole lot of belief in this rebound’s longevity.
NASDAQ Composite Daily Chart, with VXN and Volume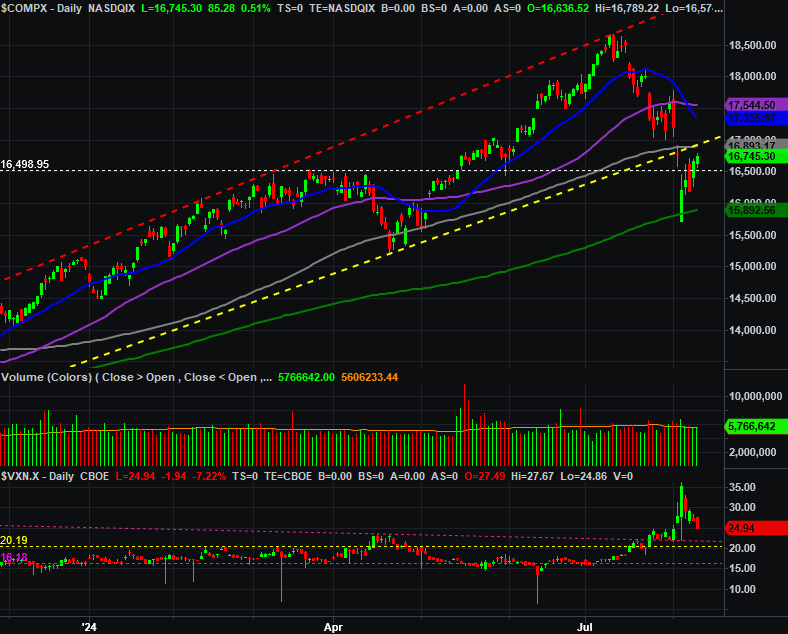
Source: TradeNavigator
Here’s the weekly chart of the NASDAQ, just for a little more perspective. Not a lot more to highlight here, however. Last week’s intraweek recovery still wasn’t even enough to lead the composite to a gain for the full week. The bigger-picture downtrend is still intact.
NASDAQ Composite Weekly Chart, with MACD and Volume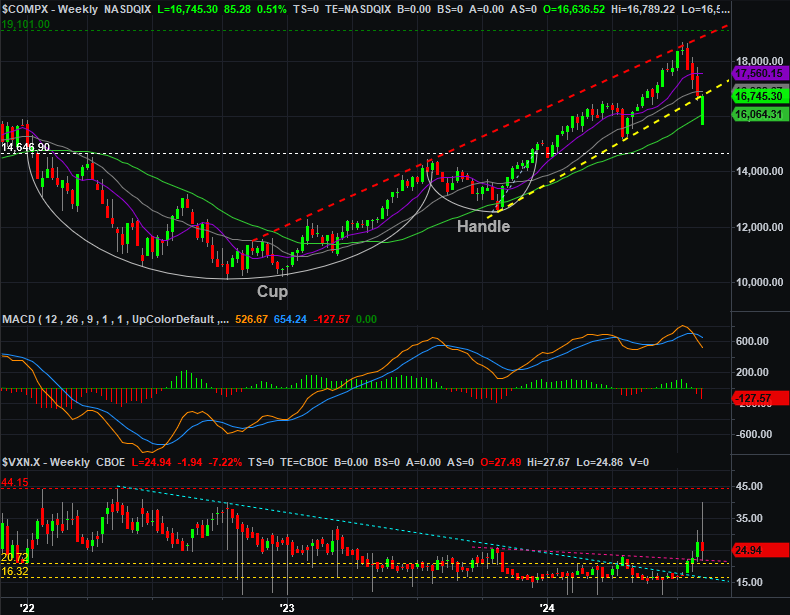
Source: TradeNavigator
This situation is complicated. This slingshot kind of action makes it near impossible to know what traders are truly thinking, and what they’re likely to do next. Which direction is the market really headed? The best guess right now is… still down. Last week seems to be nothing more than a volatility blip. Both the indexes are still below important technical ceilings. Namely, their 20-day and 50-day moving average lines.