Weekly Market Outlook – The Rally Looks Healthier Than It Really Is

Stocks logged another win last week, following through on a reversal effort that took shape three weeks ago in the wake of a serious drubbing. Still, it was a tepid effort when all was said and done… particularly in light of the fact that the Fed pretty much guaranteed interest rate cuts are coming. The bulls still need to prove they’re serious here, and that proof will only come if-and-when the market stands up to a serious test.
The good news is, that test isn’t a complicated one to grade.
We’ll show you exactly what’s wrong with the effort in a moment. Let’s first work through last week’s economic news and preview what’s coming this week.
Economic Data Analysis
There was only one area in focus last week. That’s real estate, and home sales in particular. We needed a solid showing to offset poor home sales. And, we pretty much got it. Fueled by even the slightest of declines in mortgage rates, sales of existing homes inched a little higher to an annualized pace of 3.95 million. Sales of newly-built houses, however, jumped quite a bit to multi-year clip of 739,000 units.
New, Existing Home Sales Charts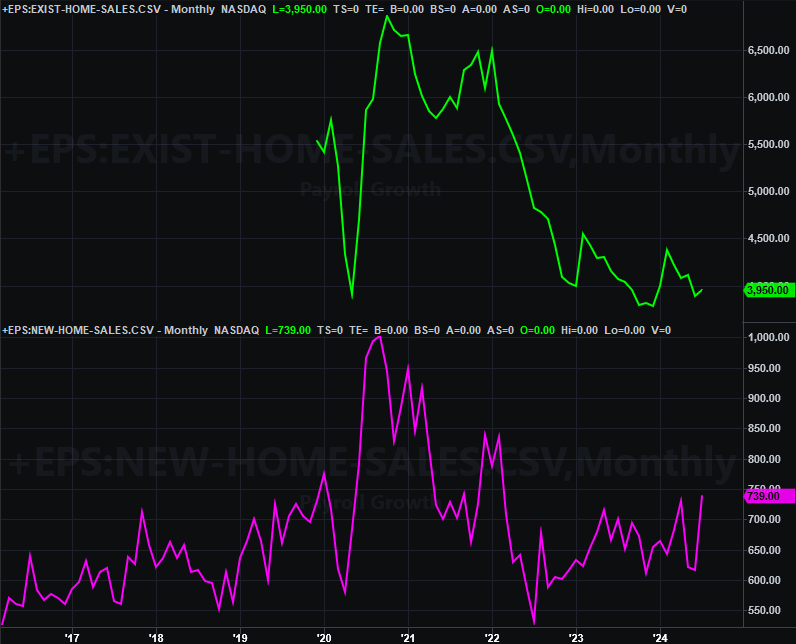
Source: National Assn. of Realtors, Census Bureau, TradeStation
One good month doesn’t start a trend. But, given the reason for the surge, this is encouraging to be sure. It says would-be buyers are responsive to even the smallest of help. They may be even more responsive once the Federal Reserve starts officially sending interest rates lower.
Everything else is on the grid.
Economic Calendar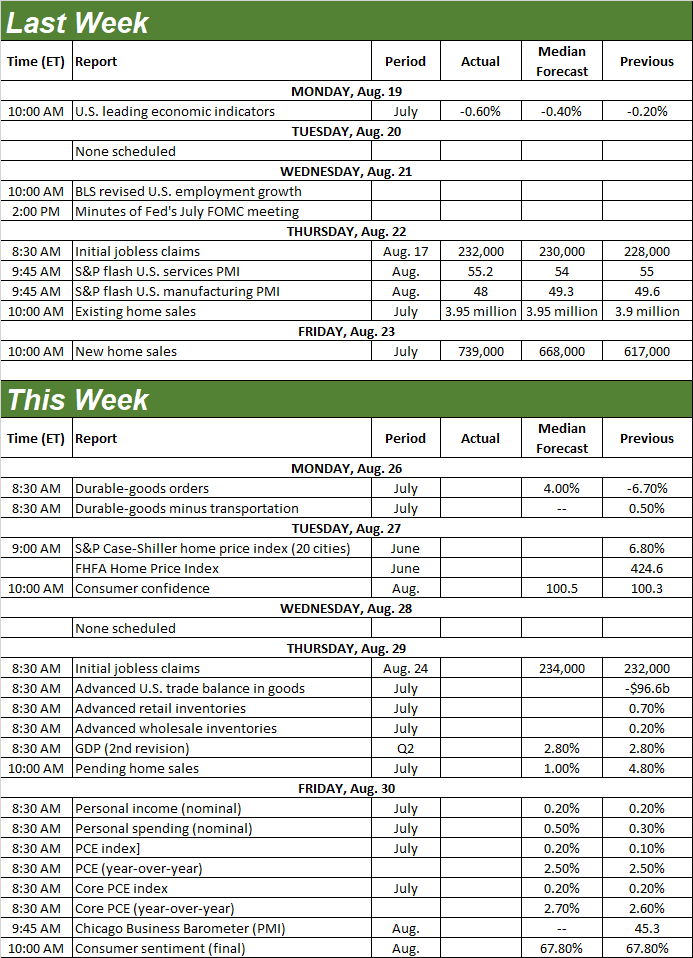
Source: Briefing.com
This week’s going to be a relatively raucous one, rounding out the real estate picture. On Tuesday look for updates of the Case-Shiller Home Price Index as well as the FHFA’s measure of the same. Just bear in mind this data will be a reflection of June’s prices rather than July’s; much could have happened in the meantime. Whatever the case, we’ve been seeing price progress even if total transactions are down. It’ll be interesting to see if any uptick in sales will actually prove to be a drag on prices.
Home Price Index Charts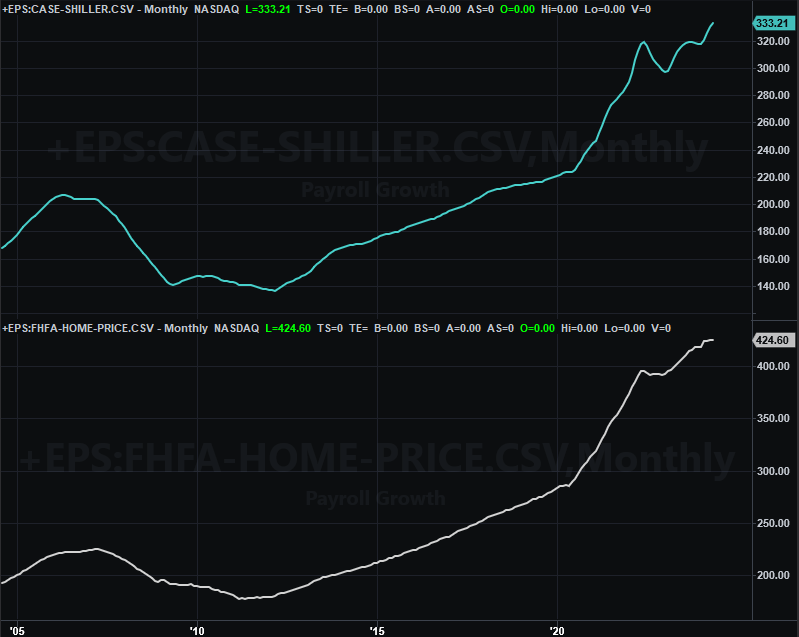
Source: Standard & Poor’s, FHFA, TradeStation
It’s also an important week for consumer sentiment measures. The Conference Board’s consumer confidence score will be posted on Tuesday, with the third and final look at the University of Michigan’s sentiment index due on Friday. Economists are calling for slight improvements for both, but only slight. It’s clear that consumers aren’t quite sure what to make of what they’re seeing now. (Also bear in mind these numbers won’t reflect the Fed’s now-amped-up likelihood of more-aggressively-dovish effort.
Consumer Sentiment Charts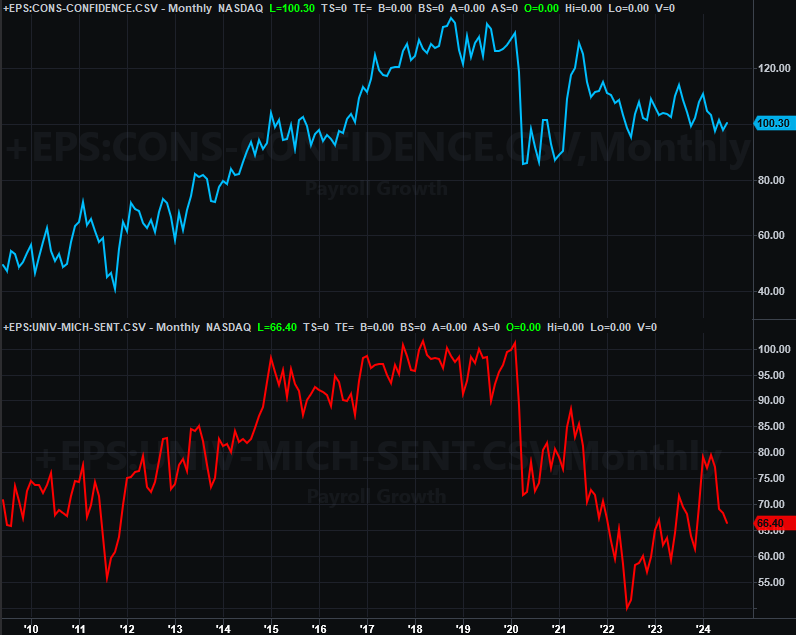
Source: Conference Board, University of Michigan, TradeStation
We’re also going to be hearing July’s personal income and spending data on Friday. Although we’re not charting it here, do know that this is data the Federal Reserve watches the most closely when making decisions regarding interest rates. Forecasts suggest last month’s figures will more or less match June’s numbers, so it’s unlikely we’ll hear or see anything that would alter the Fed’s current plans to impose at least one quarter-point cut next month.
Stock Market Index Analysis
You may recall a week ago the NASDAQ Composite had just clipped its 50-day moving average line at 17,591, but not convincingly enough to convince is it has been “cleared.” Last week’s action did the job. The composite spent almost the entirety of last week above the 50-day line (purple, on the daily chart below). In fact, it was the brief move under that level on Thursday that cemented the bullish view in place. The index only had to just pull a little bit under that mark for the bulls to file back in on Friday… although Jerome Powell certainly offered a little encouragement. The bulls have established a line in the sand.
NASDAQ Composite Daily Chart, with VXN and Volume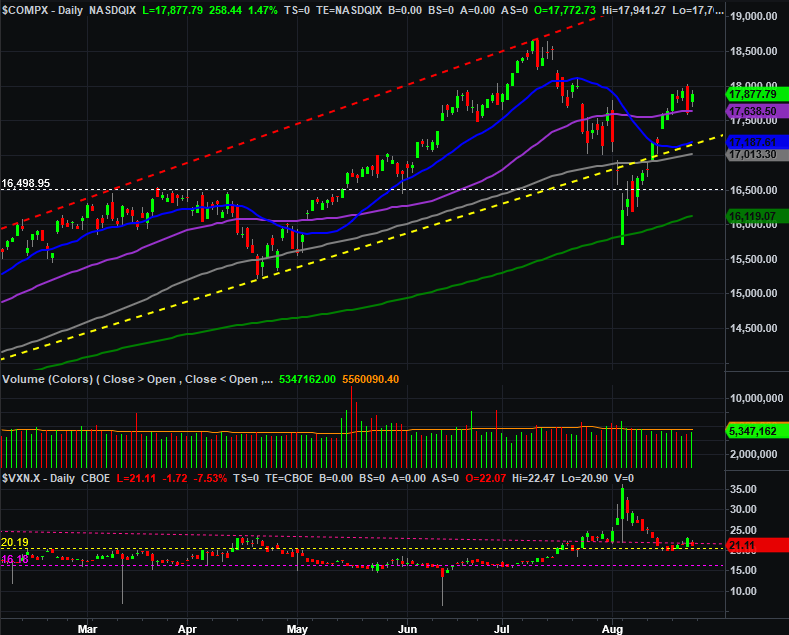
Source: TradeNavigator
The daily chart of the S&P 500 looks similar, although not identical. The 50-day moving average (again, purple) isn’t in play here, as it was hurdled a couple weeks ago. Either way, even with Thursday’s setback the S&P 500 was pushing its way higher to close out the week. This strong finish underscores the bullish thesis.
S&P 500 Daily Chart, with VIX and Volume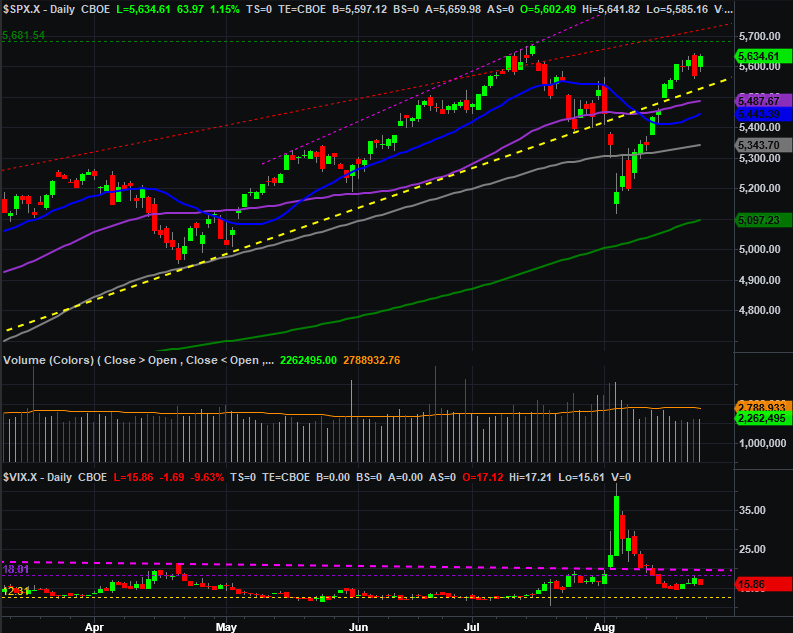
Source: TradeNavigator
Except, there are also a couple of red flags to consider here. One of them is the fact that neither the S&P 500 nor the NASDAQ Composite is making gains on rising volume. The volume behind the advance is actually subpar, in fact.
The other red flag is readily evident on the weekly chart of the S&P 500 below. That is, the index neared its recent peak at 5,669, but didn’t actually clear it.
S&P 500 Weekly Chart, with VIX and MACD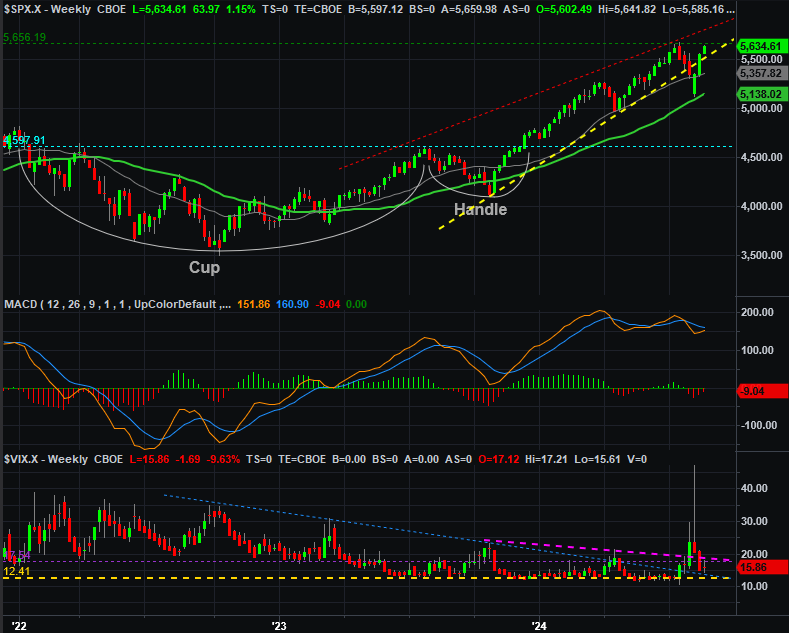
Source: TradeNavigator
The fact that things are slowing down as we approach this level implies traders are actually thinking cautiously, and unwilling to push their luck. The fact that stocks are so overbought again thanks to just the past three weeks’ gains of course underscores the notion that people aren’t wholeheartedly on board with this fresh bullishness.
So what’s the call? That’s just it. There isn’t one. The market’s not giving any great hints either way, and understandably so. Traders were and still are a little shellshocked at all the recent volatility, and are perhaps suffering a bit of whiplash from the recent plunge and subsequent rebound all just since mid-July. This volatility obscures the true undertow though. The lack of volume doesn’t help any either.
What we do know is that the rebound effort since early August has never been truly tested. It’s just that the bears haven’t bothered standing in the way. We really need to see how -- or if -- stocks will stand up to a true test. There’s a nagging suspicion they won’t, particularly given the time of year (September).
There is a prospective upside to a sizeable September setback, however. That is, it nicely sets up the usual year-end bullishness. We’ll just have to wait and see if that’s what’s in the cards this time around.